. 2018 Apr;29(4):1108-1127.
doi: 10.1681/ASN.2017060627. Epub 2018 Jan 12.

The Adiponectin Receptor Agonist AdipoRon Ameliorates Diabetic Nephropathy in a Model of Type 2 Diabetes

Affiliations

The Adiponectin Receptor Agonist AdipoRon Ameliorates Diabetic Nephropathy in a Model of Type 2 Diabetes

Yaeni Kim et al. J Am Soc Nephrol. 2018 Apr.

Abstract

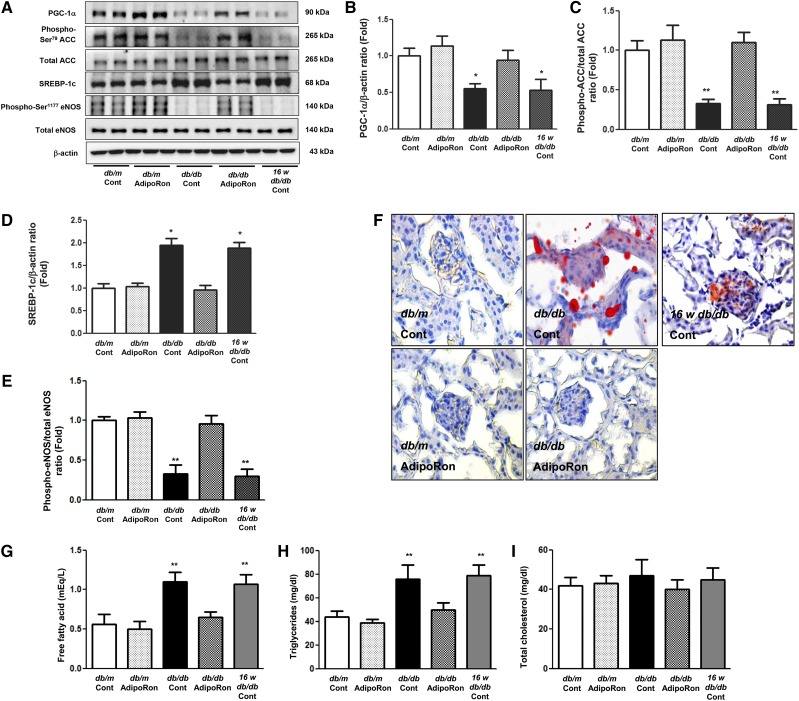
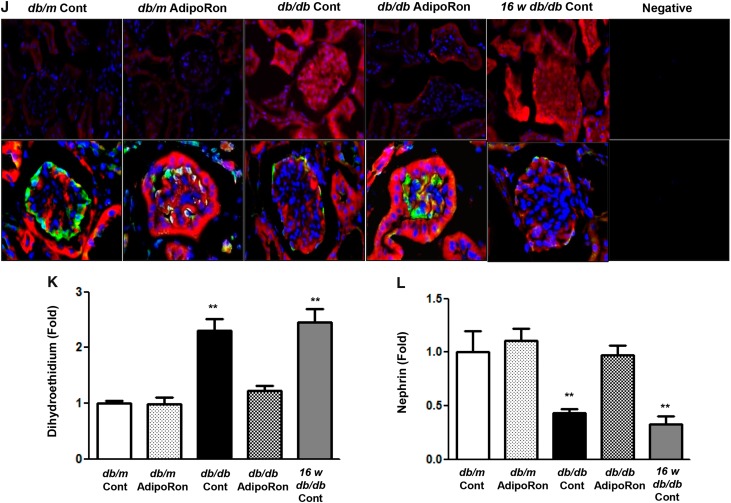
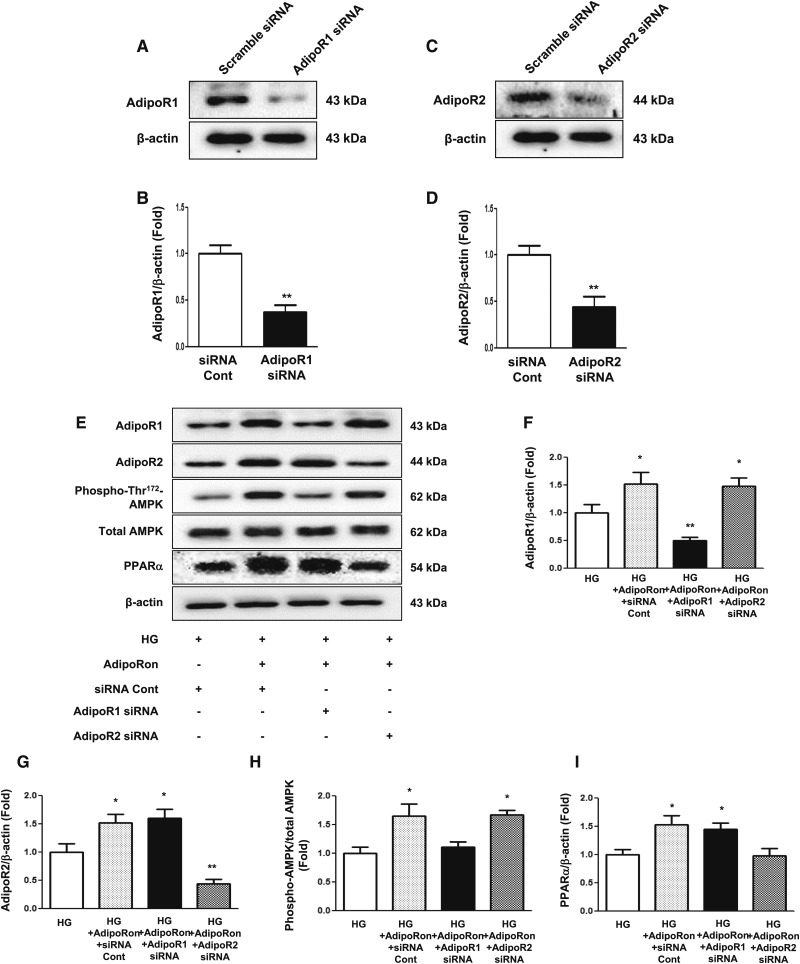
Adiponectin exerts renoprotective effects against diabetic nephropathy (DN) by activating the AMP-activated protein kinase (AMPK)/peroxisome proliferative-activated receptor-α (PPARα) pathway through adiponectin receptors (AdipoRs). AdipoRon is an orally active synthetic adiponectin receptor agonist. We investigated the expression of AdipoRs and the associated intracellular pathways in 27 patients with type 2 diabetes and examined the effects of AdipoRon on DN development in male C57BLKS/J db/db mice, glomerular endothelial cells (GECs), and podocytes. The extent of glomerulosclerosis and tubulointerstitial fibrosis correlated with renal function deterioration in human kidneys. Expression of AdipoR1, AdipoR2, and Ca2+/calmodulin-dependent protein kinase kinase-β (CaMKKβ) and numbers of phosphorylated liver kinase B1 (LKB1)- and AMPK-positive cells significantly decreased in the glomeruli of early stage human DN. AdipoRon treatment restored diabetes-induced renal alterations in db/db mice. AdipoRon exerted renoprotective effects by directly activating intrarenal AdipoR1 and AdipoR2, which increased CaMKKβ, phosphorylated Ser431LKB1, phosphorylated Thr172AMPK, and PPARα expression independently of the systemic effects of adiponectin. AdipoRon-induced improvement in diabetes-induced oxidative stress and inhibition of apoptosis in the kidneys ameliorated relevant intracellular pathways associated with lipid accumulation and endothelial dysfunction. In high-glucose-treated human GECs and murine podocytes, AdipoRon increased intracellular Ca2+ levels that activated a CaMKKβ/phosphorylated Ser431LKB1/phosphorylated Thr172AMPK/PPARα pathway and downstream signaling, thus decreasing high-glucose-induced oxidative stress and apoptosis and improving endothelial dysfunction. AdipoRon further produced cardioprotective effects through the same pathway demonstrated in the kidney. Our results show that AdipoRon ameliorates GEC and podocyte injury by activating the intracellular Ca2+/LKB1-AMPK/PPARα pathway, suggesting its efficacy for treating type 2 diabetes-associated DN.

Keywords: AdipoRon; Lipotoxicity; diabetic nephropathy; oxidative stress.


Figures

None
Graphical abstract
Figure 1.
Figure 1.
Human diabetic kidneys show characteristic diabetic alterations in line with decreased expression of intraglomerular AdipoRs and relevant molecules according to CKD stages. Representative sections stained with (A and B) PAS reagent, (C–L) immunofluorescence staining, and quantitative analyses of AdipoR1, AdipoR2, CaMKKβ, phosphorylated Ser431LKB1, phosphorylated Thr172AMPK, and nephrin levels in the human diabetic and nondiabetic kidneys according to CKD stages. *P<0.05; #P<0.001 compared with other groups.
Figure 1.
Figure 1.
Human diabetic kidneys show characteristic diabetic alterations in line with decreased expression of intraglomerular AdipoRs and relevant molecules according to CKD stages. Representative sections stained with (A and B) PAS reagent, (C–L) immunofluorescence staining, and quantitative analyses of AdipoR1, AdipoR2, CaMKKβ, phosphorylated Ser431LKB1, phosphorylated Thr172AMPK, and nephrin levels in the human diabetic and nondiabetic kidneys according to CKD stages. *P<0.05; #P<0.001 compared with other groups.
Figure 2.
Figure 2.
AdipoRon activates the CaMKKβ/phosphorylated Ser431LKB1/phosphorylated Thr172AMPK/PPARα pathway by increasing intrarenal AdipoR1/AdipoR2 expression in db/db mice. (A–C) Representative images of immunofluorescence staining and quantitative analyses of AdipoR1 and AdipoR2 expression. (D–I) Representative images of western blotting and quantitative analyses of AdipoR1, AdipoR2, CaMKKα, CaMKKβ, phosphorylated Ser431LKB1, total LKB1, and β-actin levels. (J–L) Representative images of western blotting and quantitative analyses of phosphorylated AMPK Thr172, total AMPK, PPARα, and β-actin levels. *P<0.05 and **P<0.01 versus db/db mice. Cont, control.
Figure 2.
Figure 2.
AdipoRon activates the CaMKKβ/phosphorylated Ser431LKB1/phosphorylated Thr172AMPK/PPARα pathway by increasing intrarenal AdipoR1/AdipoR2 expression in db/db mice. (A–C) Representative images of immunofluorescence staining and quantitative analyses of AdipoR1 and AdipoR2 expression. (D–I) Representative images of western blotting and quantitative analyses of AdipoR1, AdipoR2, CaMKKα, CaMKKβ, phosphorylated Ser431LKB1, total LKB1, and β-actin levels. (J–L) Representative images of western blotting and quantitative analyses of phosphorylated AMPK Thr172, total AMPK, PPARα, and β-actin levels. *P<0.05 and **P<0.01 versus db/db mice. Cont, control.
Figure 3.
Figure 3.
AdipoRon ameliorates diabetes-induced intrarenal lipotoxicity and oxidative stress in db/db mice. (A–E) Representative images of western blotting and quantitative analyses of PGC-1α, phosphorylated ACC, total ACC, SREBP-1c, phosphorylated Ser1177eNOS, total eNOS, and β-actin levels. (F–I) Representative images of oil red O staining of the renal cortex and quantitative analyses of intrarenal NEFA, TG, and TC levels. (J–L) Representative images of immunofluorescence staining and quantitative analyses of DHE and nephrin expression. *P<0.05 and **P<0.01 versus db/db mice. Cont, control.
Figure 3.
Figure 3.
AdipoRon ameliorates diabetes-induced intrarenal lipotoxicity and oxidative stress in db/db mice. (A–E) Representative images of western blotting and quantitative analyses of PGC-1α, phosphorylated ACC, total ACC, SREBP-1c, phosphorylated Ser1177eNOS, total eNOS, and β-actin levels. (F–I) Representative images of oil red O staining of the renal cortex and quantitative analyses of intrarenal NEFA, TG, and TC levels. (J–L) Representative images of immunofluorescence staining and quantitative analyses of DHE and nephrin expression. *P<0.05 and **P<0.01 versus db/db mice. Cont, control.
Figure 4.
Figure 4.
AdipoRon ameliorated features of DN through decreased intrarenal fibrosis, inflammation, apoptosis, and recovered podocyte injury. (A) Representative sections stained with PAS reagent are shown to estimate the mesangial fractional area (%) (B) together with the results of quantitative analysis according to groups. Immunohistochemical staining and quantitative analyses of (A and C) type IV collagen-, (A and D) TGF-β1-, and (A and E) F4/80-positive area. (F–I) Representative electron microscopic images of the glomerulus and quantitative analysis according to groups. (J and L, respectively) Representative images of immunofluorescence staining of TUNEL-positive endothelial cells and podocytes and (K, M, and N, respectively) quantitative analyses of the results. (O and P) Twenty-four-hour urinary 8-OH-dG and isoprostane levels in the study mice; *P<0.05, **P<0.01, and #P<0.001 compared with other groups. Col IV, type IV collagen; Cont, control.
Figure 4.
Figure 4.
AdipoRon ameliorated features of DN through decreased intrarenal fibrosis, inflammation, apoptosis, and recovered podocyte injury. (A) Representative sections stained with PAS reagent are shown to estimate the mesangial fractional area (%) (B) together with the results of quantitative analysis according to groups. Immunohistochemical staining and quantitative analyses of (A and C) type IV collagen-, (A and D) TGF-β1-, and (A and E) F4/80-positive area. (F–I) Representative electron microscopic images of the glomerulus and quantitative analysis according to groups. (J and L, respectively) Representative images of immunofluorescence staining of TUNEL-positive endothelial cells and podocytes and (K, M, and N, respectively) quantitative analyses of the results. (O and P) Twenty-four-hour urinary 8-OH-dG and isoprostane levels in the study mice; *P<0.05, **P<0.01, and #P<0.001 compared with other groups. Col IV, type IV collagen; Cont, control.
Figure 5.
Figure 5.
AdipoRon-induced increase in intracellular Ca++ concentration activates its downstream signaling and ameliorates lipotoxicity and oxidative stress in HGECs. (A–D) Intracellular Ca++ concentration in HGECs cultured in low- or high-glucose medium with or without AdipoRon. (E–G) Representative images of immunofluorescence staining and quantitative analyses of phosphorylated Ser431LKB1 and phosphorylated Thr172AMPK levels. (H) Representative images of western blotting analysis of CaMKKβ, phosphorylated Ser431LKB1, phosphorylated Thr172AMPK, total AMPK, PPARα, and β-actin levels and (I–L) their quantitative analyses. (M–Q) Representative images of western blotting and quantitative analyses of PGC-1α, phosphorylated ACC, total ACC, SREBP-1c, phosphorylated Ser1177eNOS, total eNOS, and β-actin levels. (R–T) Representative images of immunofluorescence staining and quantitative analyses of DHE expression and TUNEL-positive cells. *P<0.05 compared with LG 0; **P<0.001 compared with LG and HG control, respectively; #P<0.001 compared with LG+10 and HG+10, respectively. Cont, control; HG, high-glucose; LG, low-glucose.
Figure 5.
Figure 5.
AdipoRon-induced increase in intracellular Ca++ concentration activates its downstream signaling and ameliorates lipotoxicity and oxidative stress in HGECs. (A–D) Intracellular Ca++ concentration in HGECs cultured in low- or high-glucose medium with or without AdipoRon. (E–G) Representative images of immunofluorescence staining and quantitative analyses of phosphorylated Ser431LKB1 and phosphorylated Thr172AMPK levels. (H) Representative images of western blotting analysis of CaMKKβ, phosphorylated Ser431LKB1, phosphorylated Thr172AMPK, total AMPK, PPARα, and β-actin levels and (I–L) their quantitative analyses. (M–Q) Representative images of western blotting and quantitative analyses of PGC-1α, phosphorylated ACC, total ACC, SREBP-1c, phosphorylated Ser1177eNOS, total eNOS, and β-actin levels. (R–T) Representative images of immunofluorescence staining and quantitative analyses of DHE expression and TUNEL-positive cells. *P<0.05 compared with LG 0; **P<0.001 compared with LG and HG control, respectively; #P<0.001 compared with LG+10 and HG+10, respectively. Cont, control; HG, high-glucose; LG, low-glucose.
Figure 6.
Figure 6.
Effect of AdipoR1 and AdipoR2 siRNAs on downstream signaling of AdipoRon-treated HGECs indicates that AdipoR1 and AdipoR2 activate the AMPK and PPARα pathway, respectively. (A–I) Representative images of western blotting and quantitative analyses of AdipoR1, AdipoR2, phosphorylated Thr172AMPK, total AMPK, PPARα, and β-actin levels. (J–N) Representative images of western blotting and quantitative analyses of PGC-1α, phosphorylated ACC, total ACC, phosphorylated Ser1177eNOS, total eNOS, NOx, and β-actin levels; *P<0.05 and **P<0.01 compared with other groups. HG, high glucose; LG, low glucose.
Figure 6.
Figure 6.
Effect of AdipoR1 and AdipoR2 siRNAs on downstream signaling of AdipoRon-treated HGECs indicates that AdipoR1 and AdipoR2 activate the AMPK and PPARα pathway, respectively. (A–I) Representative images of western blotting and quantitative analyses of AdipoR1, AdipoR2, phosphorylated Thr172AMPK, total AMPK, PPARα, and β-actin levels. (J–N) Representative images of western blotting and quantitative analyses of PGC-1α, phosphorylated ACC, total ACC, phosphorylated Ser1177eNOS, total eNOS, NOx, and β-actin levels; *P<0.05 and **P<0.01 compared with other groups. HG, high glucose; LG, low glucose.

References

    1. Jiang T, Wang Z, Proctor G, Moskowitz S, Liebman SE, Rogers T, Lucia MS, Li J, Levi M: Diet-induced obesity in C57BL/6J mice causes increased renal lipid accumulation and glomerulosclerosis via a sterol regulatory element-binding protein-1c-dependent pathway. J Biol Chem 280: 32317–32325, 2005 - PubMed
    1. Goldberg IJ, Trent CM, Schulze PC: Lipid metabolism and toxicity in the heart. Cell Metab 15: 805–812, 2012 - PMC - PubMed
    1. Liu L, Shi X, Bharadwaj KG, Ikeda S, Yamashita H, Yagyu H, Schaffer JE, Yu YH, Goldberg IJ: DGAT1 expression increases heart triglyceride content but ameliorates lipotoxicity. J Biol Chem 284: 36312–36323, 2009 - PMC - PubMed
    1. Yilmaz M, Hotamisligil GS: Damned if you do, damned if you don’t: The conundrum of adipose tissue vascularization. Cell Metab 17: 7–9, 2013 - PubMed
    1. Hotta K, Funahashi T, Arita Y, Takahashi M, Matsuda M, Okamoto Y, Iwahashi H, Kuriyama H, Ouchi N, Maeda K, Nishida M, Kihara S, Sakai N, Nakajima T, Hasegawa K, Muraguchi M, Ohmoto Y, Nakamura T, Yamashita S, Hanafusa T, Matsuzawa Y: Plasma concentrations of a novel, adipose-specific protein, adiponectin, in type 2 diabetic patients. Arterioscler Thromb Vasc Biol 20: 1595–1599, 2000 - PubMed

Publication types

MeSH terms