. 2018 Jan 12;8(1):603.
doi: 10.1038/s41598-017-19093-0.

Phenotypic and Functional Characterization of Peripheral Sensory Neurons derived from Human Embryonic Stem Cells

Affiliations

Phenotypic and Functional Characterization of Peripheral Sensory Neurons derived from Human Embryonic Stem Cells

Abdullah Jawad Alshawaf et al. Sci Rep. .

Abstract

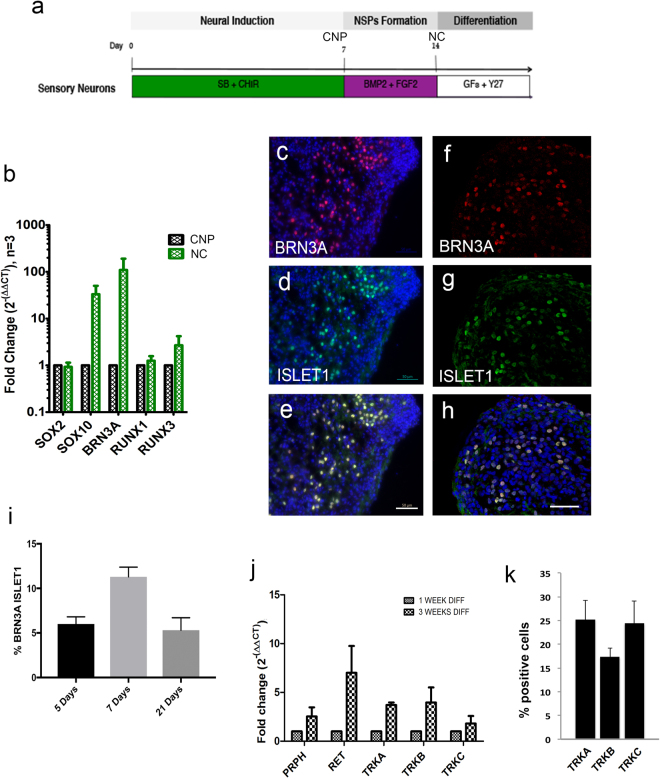
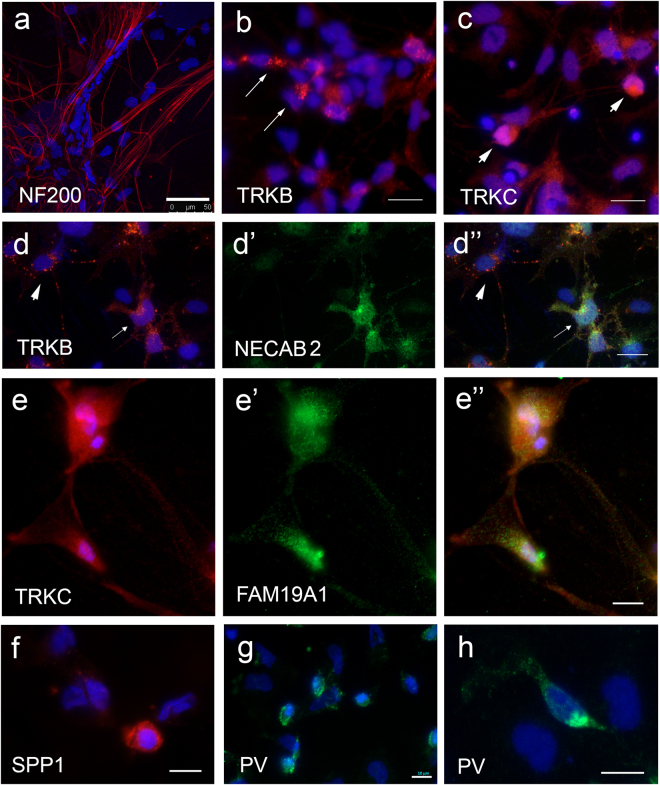
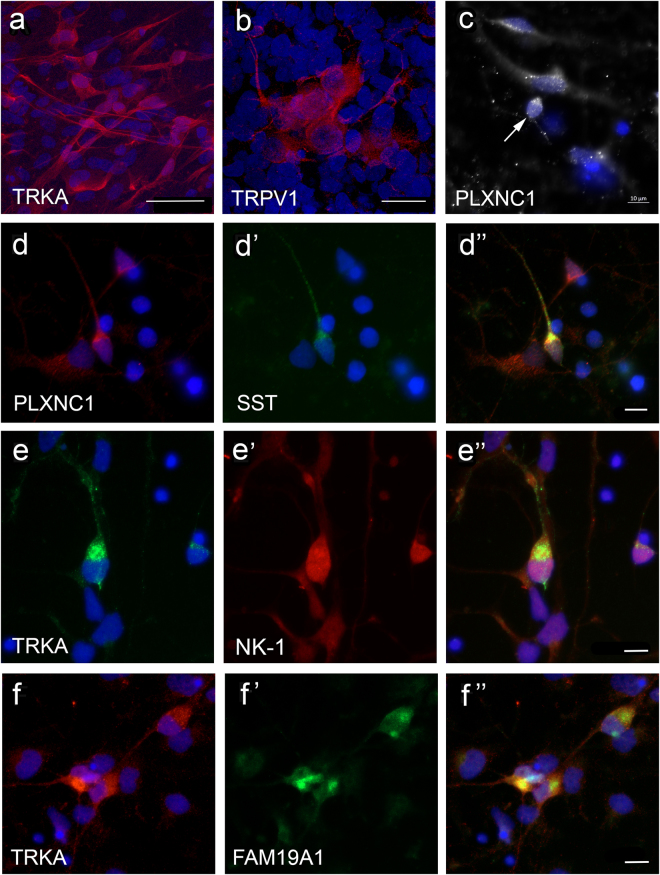
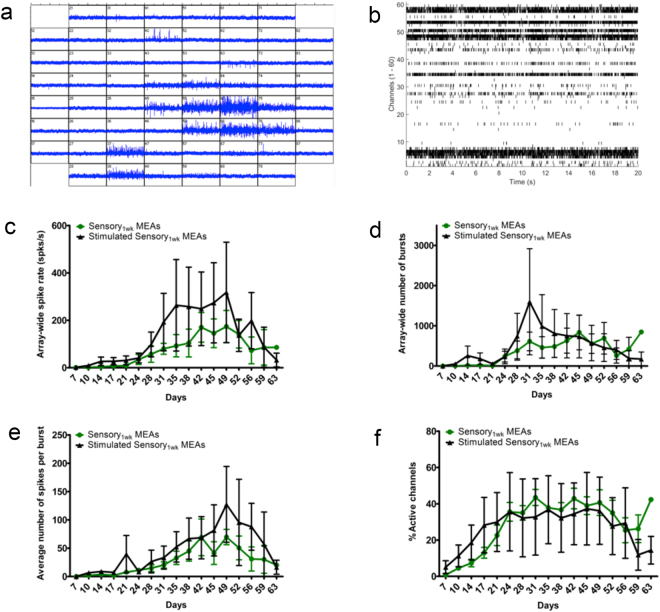
The dorsal root ganglia (DRG) consist of a multitude of sensory neuronal subtypes that function to relay sensory stimuli, including temperature, pressure, pain and position to the central nervous system. Our knowledge of DRG sensory neurons have been predominantly driven by animal studies and considerably less is known about the human DRG. Human embryonic stem cells (hESC) are valuable resource to help close this gap. Our previous studies reported an efficient system for deriving neural crest and DRG sensory neurons from hESC. Here we show that this differentiation system gives rise to heterogeneous populations of sensory neuronal subtypes as demonstrated by phenotypic and functional analyses. Furthermore, using microelectrode arrays the maturation rate of the hESC-derived sensory neuronal cultures was monitored over 8 weeks in culture, showing their spontaneous firing activities starting at about 12 days post-differentiation and reaching maximum firing at about 6 weeks. These studies are highly valuable for developing an in vitro platform to study the diversity of sensory neuronal subtypes found within the human DRG.


Conflict of interest statement

The authors declare that they have no competing interests.

Figures

Figure 1
Figure 1
Differentiation of hESC to neural crest and sensory neural progenitors. Schematic diagram outlining stages of neural induction, formation of neural crest neurospheres and differentiation to sensory neurons. (b) Q-PCR data shows higher expression of neural crest marker SOX10 and peripheral sensory markers BRN3A, RUNX1 and RUNX3 in neural crest neurospheres relative to caudal neural progenitors. Each experiment has >3 neurospheres and at least 3 independent experiments. (cf) Neural crest progenitors differentiated for 5 days (ce) and 21 days (f,g) show co-expression of BRN3A (c,e,f and h, red) and ISLET1 (d,e,g and h, green). Dapi nuclei are shown in blue (c,d,e and h). Scale bars = 50 µm (e,h). (i) Graph showing percentages of neurons co-expressing BRN3A and ISLET1 at 5, 7 and 21 days of differentiation, which are 6.00 ± 0.80 SEM %, 11.03 ± 1.08 SEM % and 5.31 ± 1.39 SEM %, respectively. (j) Q-PCR data showing an increase in expression of sensory neuronal markers, Peripherin, RET, TRKA, TRKB and TRKC, at 3 weeks of differentiation relative to 1 week differentiation. N > 3 independent experiments, each experiment has >3 replicate samples. (k) Percentage of neurons expressing TRKA (25.20 ± 4.04 SEM), TRKB (17.35 ± 1.82 SEM) and TRK C (24.42 ± 4.75 SEM). Abbreviations: CHIR, CHIR99021; CNP, caudal neural progenitors; GF, growth factors; NC, neural crest; NSPs, neurospheres; SB, SB431542; Y27, Y27632.
Figure 2
Figure 2
Expression of mechanoreceptor and proprioceptor subtype markers in hESC-derived sensory neuronal cultures. Differentiated neurons were positive for NF200 (a, red), TRKB (b, red, arrows) or TRKC (c, red, arrows). (d-d”) A subset of TRKB+ neurons (d and d”, red) co-expressed NECAB (d’ and d”, green, arrows). TRKB + and NECAB 2 neurons (d-d”, arrowhead) were also observed. (e-e”) Neuron co-expressing TRKC (e and e” red) and FAM19A1 (e’ and e”, green). (fh) Expression of proprioceptors markers, SPP1 (f, red) and PV (g and h, green) in differentiated cultures. Dapi stains of nuclei are shown in blue. Scale bars = 10 µm (e,f,g and h), 20 µm (b,c and d) and 50 µm (a). Abbreviations: FAM19A1, family with sequence similarity 19 member A1; NECAB 2, N-terminal EF-hand calcium binding protein 2; NF200, Neurofilament 200; PV, parvalbumin; SPP1, osteopontin (secreted phosphoprotein 1).
Figure 3
Figure 3
Expression of markers of nociceptor peptidergic and non-peptidergic subtypes in hESC-derived sensory neuronal cultures. (ac) Differentiated cultures show clusters of neurons expressing TRKA (a, red), TRPV1 (b, red) and plexin C1 (c, white). (d) A subpopulation of plexin C1 (d and d”) also expressed SST (d’ and d”, green). (e,f) Peptidergic neurons showing co-expression of TRKA (e and e”, green) and substance P receptor (e’ and e”, red) or TRKA (f and f”, red) and FAM19A1 (f’ and f”, green). Dapi stains of nuclei are shown in blue. Scale bars = 10 µm (c, d”, e” and f”). Abbreviations: FAM19A1, family with sequence similarity 19 member A1; PLXNC1, plexin C1; SST, somatostatin; NK-1, substance P receptor.
Figure 4
Figure 4
Temporal functional profile of hESC-derived sensory neuronal cultures. (a,b) Representative snap shot images of a 1 second duration MEA recording (a) and a 20 second duration raster plot (b) for non-stimulated MEA cultures. (cg) Functionality of non-stimulated and stimulated MEA cultures including: measurements of array-wide spike rate (c), array-wide number of bursts (d), array-wide number of spikes per burst (e) and percentage of active electrodes (f) over 60 days were examined on each MEA for each condition; unstimulated MEAs (green) and stimulated MEAs (black). Data for each condition are presented as mean and error bars represent standard error of the mean (SEM).
Figure 5
Figure 5
Response of sensory neurons to heat stimuli. (a,e and i) Raw data recordings from 3 different channels showing different spiking responses to changes in temperature over the whole recording (540 seconds), with insets showing an example of spikes in segments of the raw data on the top. (b,f and j) Corresponding raster plot of a single unit isolated from raw data in a, e or i respectively, showing its response to changes in temperature over the whole recording (540 seconds). (c,g and k) Frequency histogram (spikes/1 sec) of a single unit isolated from the raw data in a, e and i respectively. (d,h and l) Line chart showing corresponding temperature changes over the whole recording (540 seconds) for each of a, e and i, where the MEA is incrementally heated (1 °C/30 seconds) from 37 °C to 45 °C and cooled back to 37 °C at the same rate. (ad) This single unit showed activity only in response to noxious heat 44 °C-45 °C. (eh) This single unit showed an increase in frequency of spike activity in response to changes in temperature from 42 °C-44 °C. (il) This single unit showed no response to changes in temperature. (m) Scatter plot grouping channels according to their spiking profile in response to 45 °C relative to baseline 37 °C. Spiking activities from active channels were grouped into 3 categories either no activity at baseline then become active at 45 °C (red circles), active at baseline and showed more activity at 45 °C (black squares) or no change at 45 °C (blue triangles). Data are from weekly recordings of 2 MEAs spanning week 3 to week 8 of differentiation. Mean and standard error of the mean (SEM) are shown.
Figure 6
Figure 6
Response of sensory neurons to hypoosmotic stimulus. (a) Percentage of active channels in response to reduction in extracellular osmolarity from 300 mOsm/Kg to 177 mOsm/Kg. This data is from weekly recordings of 2 MEAs for a total of 2–3 weeks (5 recording sessions in total). Mean and standard error of the mean (SEM) are shown. Statistical significance was assessed using Krustal-Wallis test with Dunn’s multiple comparison post-test. *P < 0.05 (b) Snapshot images of raw data for 5 minute recordings from one channel at each extracellular osmolarity: 300 mOsm/Kg, 260 mOsm/Kg, 217 mOsm/Kg, and 177 mOsm/Kg. Magnified segments of the raw data recording are shown on the right side.

Similar articles

Cited by

References

    1. Le Pichon CE, Chesler AT. The functional and anatomical dissection of somatosensory subpopulations using mouse genetics. Front Neuroanat. 2014;8:21. doi: 10.3389/fnana.2014.00021. - DOI - PMC - PubMed
    1. Fleming, M. S. & Luo, W. The anatomy, function, and development of mammalian Abeta low-threshold mechanoreceptors. Front Biol (Beijing)8, 10.1007/s11515-013-1271-1 (2013). - PMC - PubMed
    1. Ernsberger U. Role of neurotrophin signalling in the differentiation of neurons from dorsal root ganglia and sympathetic ganglia. Cell Tissue Res. 2009;336:349–384. doi: 10.1007/s00441-009-0784-z. - DOI - PubMed
    1. Usoskin D, et al. Unbiased classification of sensory neuron types by large-scale single-cell RNA sequencing. Nat Neurosci. 2015;18:145–153. doi: 10.1038/nn.3881. - DOI - PubMed
    1. Li CL, et al. Somatosensory neuron types identified by high-coverage single-cell RNA-sequencing and functional heterogeneity. Cell Res. 2016;26:83–102. doi: 10.1038/cr.2015.149. - DOI - PMC - PubMed

Publication types