

Metagenomic and metabolomic analyses unveil dysbiosis of gut microbiota in chronic heart failure patients
- PMID: 29330424
- PMCID: PMC5766622
- DOI: 10.1038/s41598-017-18756-2
Metagenomic and metabolomic analyses unveil dysbiosis of gut microbiota in chronic heart failure patients
Abstract
Previous studies suggested a possible gut microbiota dysbiosis in chronic heart failure (CHF). However, direct evidence was lacking. In this study, we investigated the composition and metabolic patterns of gut microbiota in CHF patients to provide direct evidence and comprehensive understanding of gut microbiota dysbiosis in CHF. We enrolled 53 CHF patients and 41 controls. Metagenomic analyses of faecal samples and metabolomic analyses of faecal and plasma samples were then performed. We found that the composition of gut microbiota in CHF was significantly different from controls. Faecalibacterium prausnitzii decrease and Ruminococcus gnavus increase were the essential characteristics in CHF patients' gut microbiota. We also observed an imbalance of gut microbes involved in the metabolism of protective metabolites such as butyrate and harmful metabolites such as trimethylamine N-oxide in CHF patients. Metabolic features of both faecal and plasma samples from CHF patients also significantly changed. Moreover, alterations in faecal and plasma metabolic patterns correlated with gut microbiota dysbiosis in CHF. Taken together, we found that CHF was associated with distinct gut microbiota dysbiosis and pinpointed the specific core bacteria imbalance in CHF, along with correlations between changes in certain metabolites and gut microbes.
Conflict of interest statement
The authors declare that they have no competing interests.
Figures
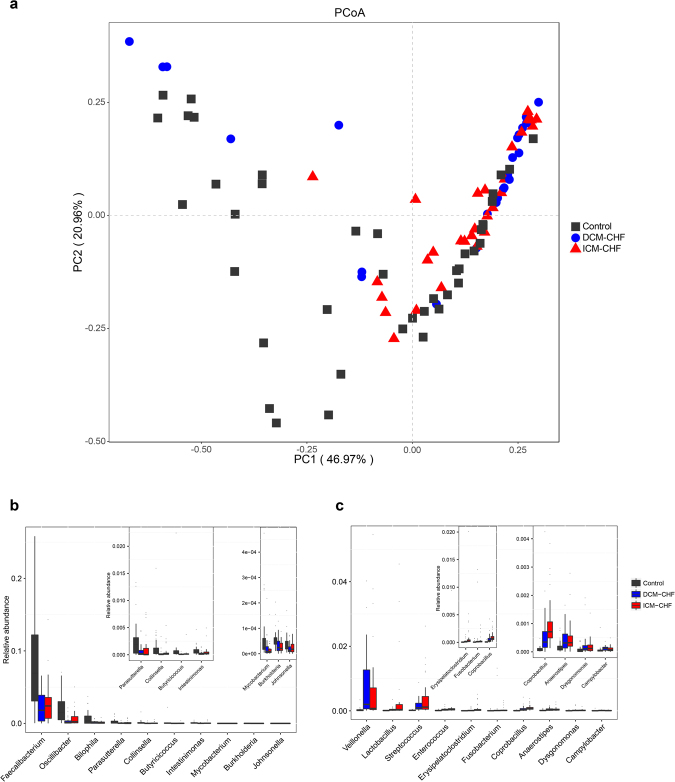
 represents control. The
  represents DCM-induced CHF. The
  represents ICM-induced CHF. (b,c) Boxplot of top ten genera differentially enriched in CHF patients (b) and controls (b). Black, controls; blue, DCM-induced CHF patients; red, ICM- induced CHF patients.
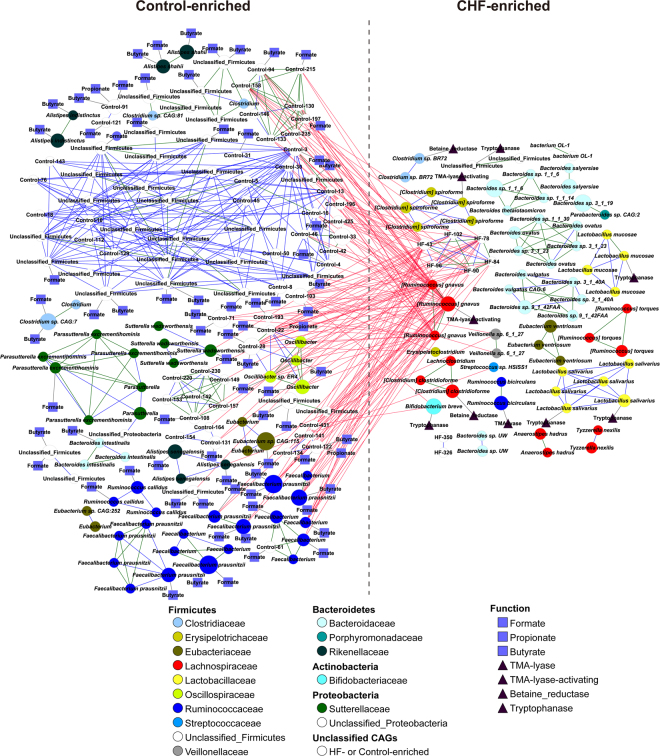
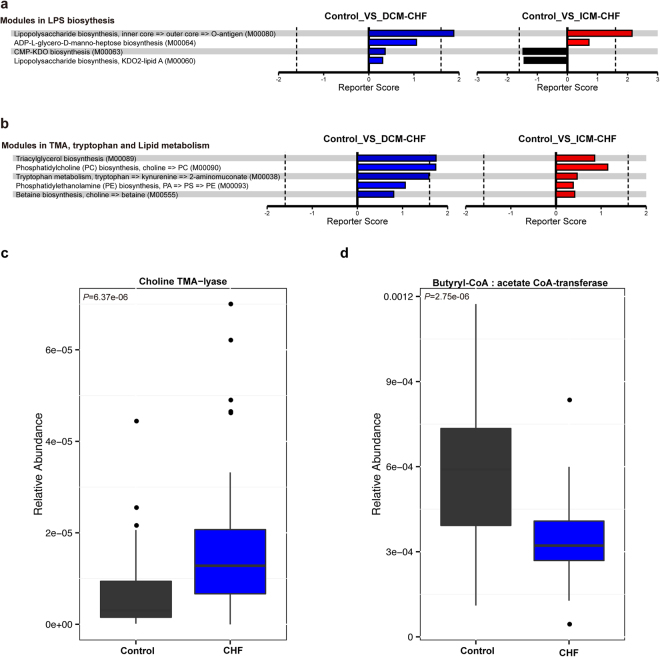
 represented the presence of the genes encoding choline TMA-lyase, choline TMA-lyase-activating enzyme, betaine reductase or tryptophanase. The
  represented the presence of the genes encoding butyrate-acetoacetate CoA transferase, propionate CoA-transferase or formate-tetrahydrofolate ligase.
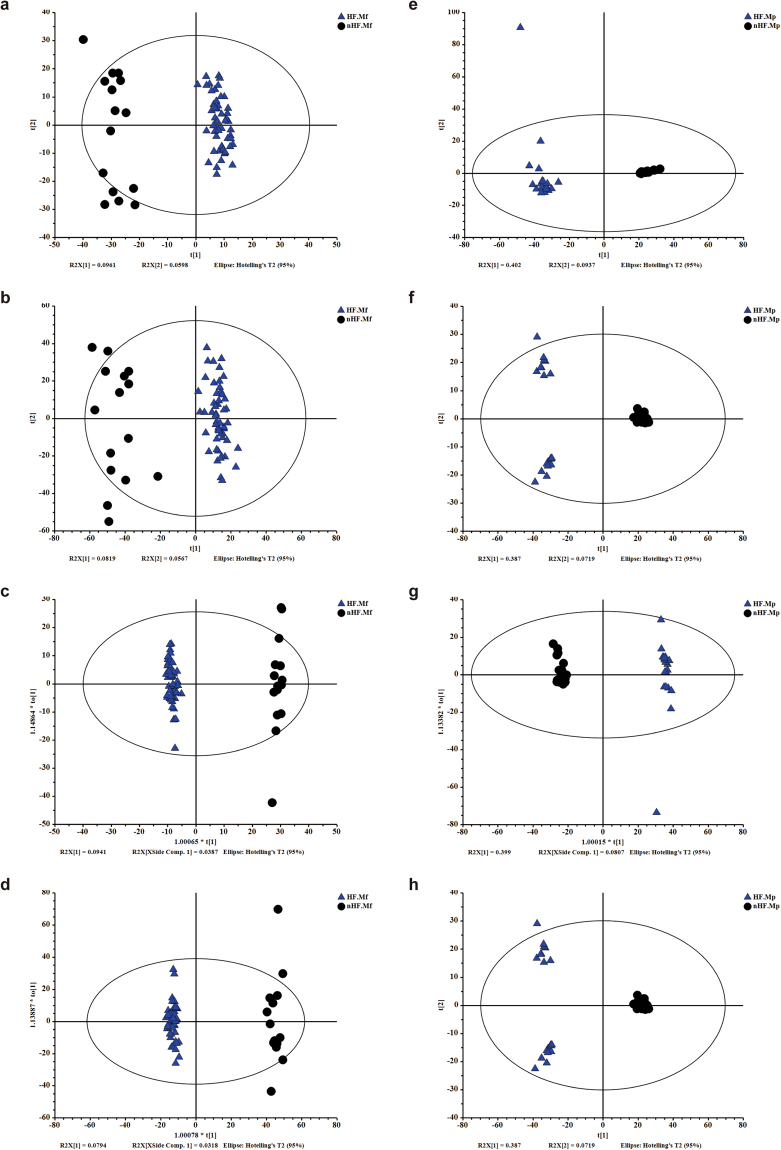
 represents metabolic profiles of CHF patients. The
  represents metabolic profiles of controls. ES+ = positive ion mode; ES− = negative ion mode.
References
-
- McMurray JJ, Petrie MC, Murdoch DR, Davie AP. Clinical epidemiology of heart failure: public and private health burden. Eur Heart J. 1998;19(Suppl P):P9–16. - PubMed
Publication types
MeSH terms
Substances
LinkOut - more resources
Full Text Sources
Other Literature Sources
Medical
