. 2018 Jan 12;8(1):587.
doi: 10.1038/s41598-017-19057-4.

Targeting melanoma stem cells with the Vitamin E derivative δ-tocotrienol

Affiliations

Targeting melanoma stem cells with the Vitamin E derivative δ-tocotrienol

Monica Marzagalli et al. Sci Rep. .

Abstract

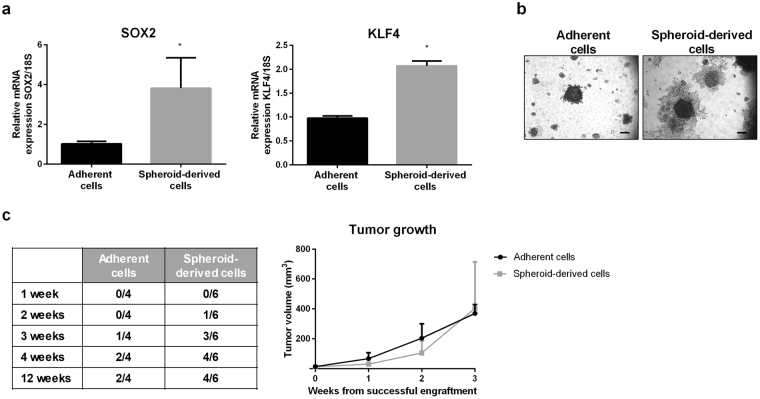
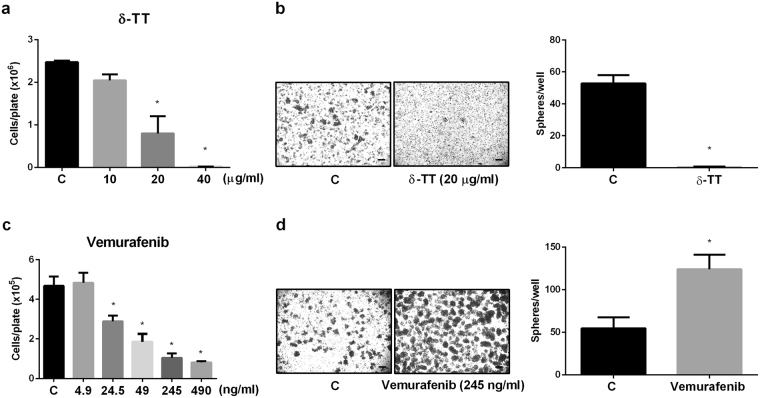
The prognosis of metastatic melanoma is very poor, due to the development of drug resistance. Cancer stem cells (CSCs) may play a crucial role in this mechanism, contributing to disease relapse. We first characterized CSCs in melanoma cell lines. We observed that A375 (but not BLM) cells are able to form melanospheres and show CSCs traits: expression of the pluripotency markers SOX2 and KLF4, higher invasiveness and tumor formation capability in vivo with respect to parental adherent cells. We also showed that a subpopulation of autofluorescent cells expressing the ABCG2 stem cell marker is present in the A375 spheroid culture. Based on these data, we investigated whether δ-TT might target melanoma CSCs. We demonstrated that melanoma cells escaping the antitumor activity of δ-TT are completely devoid of the ability to form melanospheres. In contrast, cells that escaped vemurafenib treatment show a higher ability to form melanospheres than control cells. δ-TT also induced disaggregation of A375 melanospheres and reduced the spheroidogenic ability of sphere-derived cells, reducing the expression of the ABCG2 marker. These data demonstrate that δ-TT exerts its antitumor activity by targeting the CSC subpopulation of A375 melanoma cells and might represent a novel chemopreventive/therapeutic strategy against melanoma.


Conflict of interest statement

The authors declare that they have no competing interests.

Figures

Figure 1
Figure 1
Identification of stem cell-like subpopulations in human melanoma cell lines. (a) The spheroidogenic potential of A375 and BLM cells was assessed by plating cells in stem cell medium (Euromed-N), supplemented with 10 ng/ml EGF, 10 ng/ml FGF, 1% N2. Melanosphere growth was monitored for up to 15 days, and cells were photographed at different time points with a 10 × /1.4 objective lens (scale bar, 30 μm). (b) The protein expression of three melanoma stem cell markers was assessed by Western blot analysis. GAPDH expression was evaluated as a loading control. One representative of three different experiments, for each analysis performed, is shown. Cropped gels/blots are displayed. Original uncropped Western blots were reported in the Supplementary Figure S1A. (c) Immunofluorescence analysis was performed in order to verify the pattern of distribution of ABCB5, CD44 and CD271 in A375 and BLM cells. Cells were photographed with a 63 × /1.4 objective lens (scale bar, 5 μm). One representative of three different experiments is shown.
Figure 2
Figure 2
A375 spheroid-derived cells show CSCs traits. (a) The mRNA expression levels of the two embryonic stem cell markers SOX2 and KLF4 were measured by real-time RT-PCR, in both adherent and spheroid-derived cells. Three replicates were performed, and the experiment was repeated three times. Data were analyzed by unpaired t-test, and represent mean values ± SEM (*p < 0.05 vs Adherent cells). (b) The invasive ability of adherent and spheroid-derived cells was assessed by Matrigel invasion assay. Cells were seeded on Matrigel-coated plates and left to grow for up to 15 days. Cells were then photographed with a 4 × /1.4 objective lens (scale bar, 75 μm). One representative of three different experiments is shown. (c) The in vivo capability to originate tumors was assessed by transplantation of adherent or spheroid-derived cells (5 × 105) into immunodeficient mice. Tumor take was assessed by palpation (twice/week) for up to 12 weeks (left panel). The growth rate of engrafted and generated tumors (n = 2 in adherent and n = 4 in spheroid-derived cells) was monitored weekly by measuring tumor size and calculating tumor volume (mm3) as [length (mm) x width2 (mm2)/2] (right panel).
Figure 3
Figure 3
Flow cytometry analysis of CD271 staining on A375 adherent cells vs spheroid-derived cells. The proportion of CD271-positive cells was measured in A375 adherent cells or their spheroid-forming counterpart. Gating strategy was based on negative controls, without incubation with the specific antibody. Data were analyzed by unpaired t-test, and are represented by mean values ± SEM. One representative of four different experiments is shown.
Figure 4
Figure 4
Intracellular autofluorescence, associated with ABCG2 expression, is a novel marker for A375 CSCs. (a) Cellular autofluorescence (λem 532 nm) was measured in A375 adherent and spheroid-derived cells by flow cytometry, observing the presence of two cell populations. Data were analyzed by unpaired t-test, and are represented as mean values ± SEM (*p < 0.05 vs Adherent cells). One representative of four different experiments is shown. (b) The proportion of ABCG2-positive cells was measured in adherent or melanosphere-derived cells. Gating strategy was based on negative controls, without incubation with the specific antibody. Data were analyzed by unpaired t-test and are represented by mean values ± SEM (*p < 0.05 vs Adherent cells). One representative of four different experiments is shown. (c) The relationship between autofluorescence and ABCG2 expression in melanosphere-derived cells was analyzed by flow cytometry. Gating strategy was based on negative controls, without incubation with the specific antibody (left panel). Moreover, highly autofluorescent cells were gated and analyzed for their ABCG2 positivity (right panel). One representative of three different experiments is shown.
Figure 5
Figure 5
δ-TT and vemurafenib differentially affect the formation of primary A375 melanospheres. (a) Adherent cells were treated with scaling doses (10–40 μg/ml) of δ-TT for 18 h, then cell proliferation was assessed by cell counting. Data represent mean values ± SEM and were analyzed by Dunnett’s test after one-way analysis of variance (*p < 0.05 vs C). One representative of three different experiment is shown. (b) In order to assess the ability of δ-TT to affect the formation of melanospheres, adherent cells were treated with the compound (20 μg/ml) for 18 h, replated in stem cell medium and left to grow for up to 15 days. Melanospheres were photographed by a 4 × /1.4 objective lens (left panel, scale bar, 75 μm), and counted for each well (right panel). Data were analyzed by unpaired t-test, and are represented as mean values ± SEM (*p < 0.05 vs C). One representative of three different experiments is shown. (c) Vemurafenib treatment was performed in order to compare the effect of δ-TT with the standard therapy. Adherent cells were treated with scaling doses of this compound (4.9–490 ng/ml; 10–1000 nM) for 96 h and then cell proliferation was assessed by counting the cells. Data represent mean values ± SEM and were analyzed by Bonferroni’s test after one-way analysis of variance (*p < 0.05 vs C). One representative of three different experiments is shown. (d) Adherent cells were treated with 245 ng/ml (500 nM) of this compound for 96 h, then cells were replated in stem cell medium, and left to grow for up to 15 days. Melanospheres were photographed by a 4 × /1.4 objective lens (left panel, scale bar, 75 μm), and counted for each well (right panel). Data were analyzed by unpaired t-test, and are represented as mean values ± SEM (*p < 0.05 vs C). One representative of three different experiments is shown. C, controls.
Figure 6
Figure 6
δ-TT impairs the growth of A375 melanospheres. (a) A375 melanospheres were collected and treated with 20 or 40 μg/ml of δ-TT for 5 days. Spheres were then photographed with a 4 × /1.4 (upper panels, scale bar, 75 μm) or a 10 × /1.4 (lower panels, scale bar, 30 μm) objective lens, in order to capture number, size and morphology changes. (b) In order to assess the effects of δ-TT on melanosphere growth, melanosphere-derived cells were plated (3 × 104 cells/well), and treated (40 μg/ml) during melanosphere formation, once/week for two weeks. At the end of the treatment, spheres were photographed with a 4 × /1.4 objective lens (scale bar, 75 μm), and counted for each well. Data were analyzed by unpaired t-test, and are represented by mean values ± SEM (*p < 0.05 vs C). (c) Protein extracts from the same experiment (b) were collected, and the expression of ABCG2 was analyzed by Western blot. Evaluation of GAPDH expression was used as a loading control. Densitometric analysis was performed with ImageJ software, data were analyzed by unpaired t-test and are represented by mean values ± SEM (*p < 0.05 vs C). One representative of three different experiments is shown. C, controls. Cropped gels/blots are displayed. Original uncropped Western blots were reported in the Supplementary Figure S1B.

References

    1. Siegel RL, Miller KD, Jemal A. Cancer Statistics, 2017. CA Cancer J. Clin. 2017;67:7–30. doi: 10.3322/caac.21387. - DOI - PubMed
    1. Achkar T, Tarhini AA. The use of immunotherapy in the treatment of melanoma. J Hematol. Oncol. 2017;10:88. doi: 10.1186/s13045-017-0458-3. - DOI - PMC - PubMed
    1. Kalal BS, Upadhya D, Pai VR. Chemotherapy Resistance Mechanisms in Advanced Skin Cancer. Oncol. Rev. 2017;11:326. doi: 10.4081/oncol.2017.326. - DOI - PMC - PubMed
    1. Omholt K, Platz A, Kanter L, Ringborg U, Hansson J. NRAS and BRAF mutations arise early during melanoma pathogenesis and are preserved throughout tumor progression. Clin. Cancer Res. 2003;9:6483–6488. - PubMed
    1. Liu M, et al. Efficacy and safety of BRAF inhibition alone versus combined BRAF and MEK inhibition in melanoma: a meta-analysis of randomized controlled trials. Oncotarget. 2017;8:32258–32269. - PMC - PubMed

Publication types

MeSH terms