. 2018 Jan 12;9(1):180.
doi: 10.1038/s41467-017-02699-3.

Recent enhanced high-summer North Atlantic Jet variability emerges from three-century context

Affiliations

Recent enhanced high-summer North Atlantic Jet variability emerges from three-century context

V Trouet et al. Nat Commun. .

Abstract

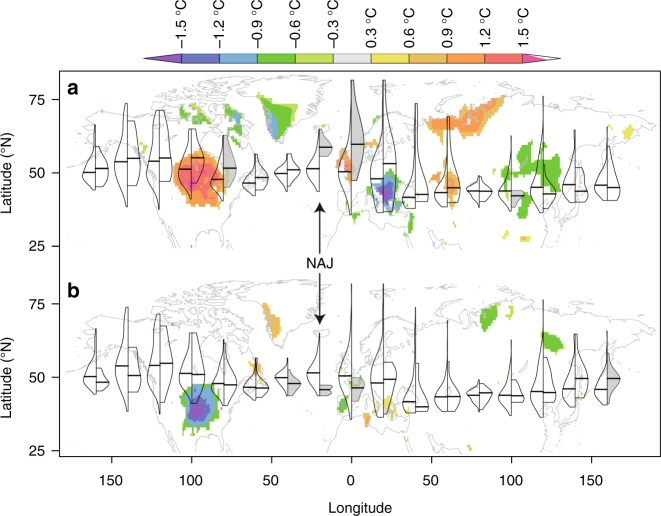
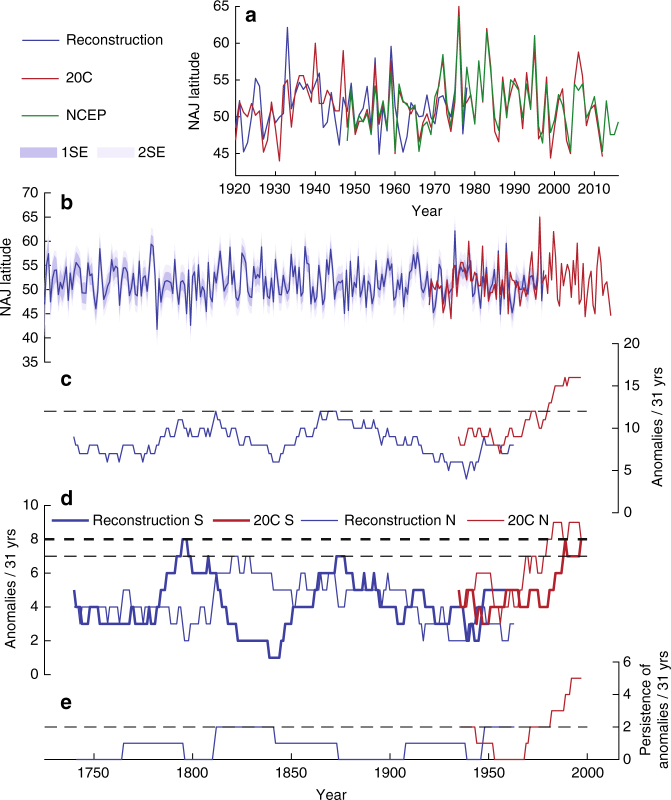
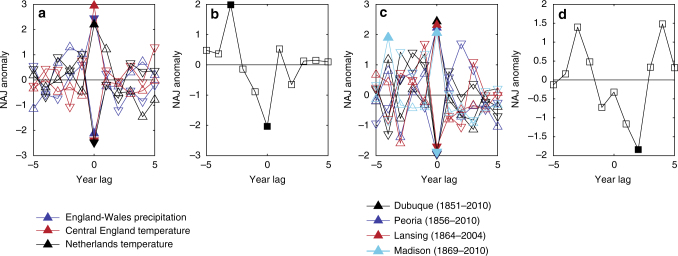
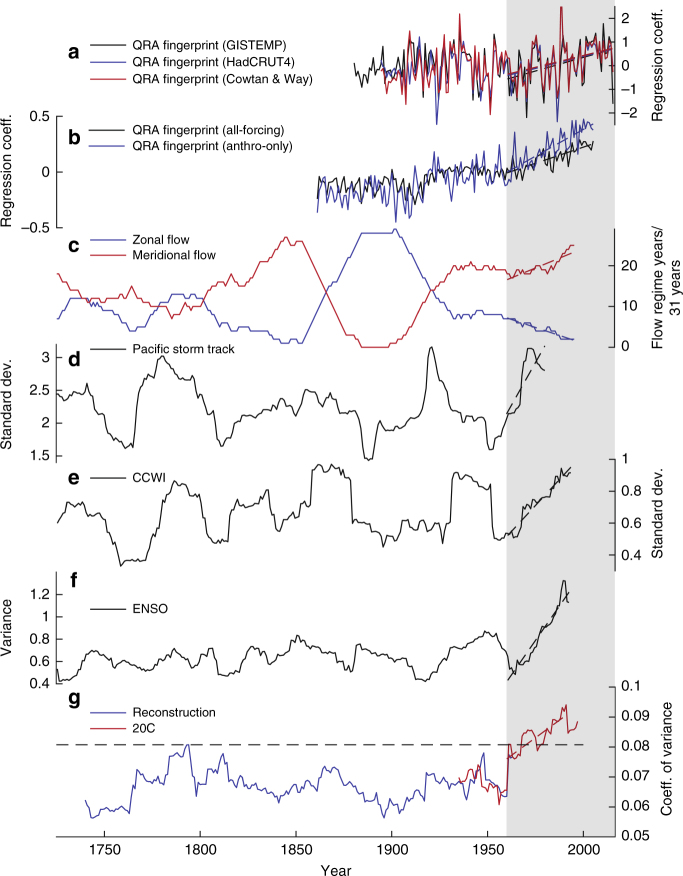
A recent increase in mid-latitude extreme weather events has been linked to Northern Hemisphere polar jet stream anomalies. To put recent trends in a historical perspective, long-term records of jet stream variability are needed. Here we combine two tree-ring records from the British Isles and the northeastern Mediterranean to reconstruct variability in the latitudinal position of the high-summer North Atlantic Jet (NAJ) back to 1725 CE. We find that northward NAJ anomalies have resulted in heatwaves and droughts in northwestern Europe and southward anomalies have promoted wildfires in southeastern Europe. We further find an unprecedented increase in NAJ variance since the 1960s, which co-occurs with enhanced late twentieth century variance in the Central and North Pacific Basin. Our results suggest increased late twentieth century interannual meridional jet stream variability and support more sinuous jet stream patterns and quasi-resonant amplification as potential dynamic pathways for Arctic warming to influence mid-latitude weather.


Conflict of interest statement

The authors declare no competing financial interests.

Figures

Fig. 1
Fig. 1
Latitudinal position of the August Northern Hemisphere Jet. Left wings of the violins represent the August Northern Hemisphere Jet latitudinal position distribution over the instrumental period (1920–2012) for 20° longitudinal slices. Right wings represent distribution during anomalous years when the North Atlantic Jet (NAJ; 10–30°W) latitudinal position exceeded 1 stdev northwards (a) or southwards (b). Gray shading indicates significant differences between the left and right distributions (one-sided Kolmogorov–Smirnov test; p < 0.05). Background map shows August surface temperature anomalies (°C; CRUTEM3.21) composited over the anomalous years. Composite maps were created in R with color palette adapted from the KNMI Climate Explorer (https://climexp.knmi.nl)
Fig. 2
Fig. 2
BRIT and NEMED tree-ring chronologies. a, b Pearson's correlation maps of BRIT (a) and NEMED (b) tree-ring chronologies with gridded 1° CRU TS4.0 August temperature anomaly fields (1901–1978) over Europe. Correlation coefficients higher than 0.3 are significant at the p < 0.01 significance level. c BRIT and NEMED (inversed) tree-ring chronologies (1725–1978) and d their sample replication over time. e The 31-year running Pearson's correlation coefficients between the BRIT and NEMED chronologies are consistently negative over the full period, except for years (1740, 1812, 1816) when external forcings created cold conditions throughout Europe. Correlation coefficients below −0.374 (dashed line) are significant at the p < 0.05 level. Correlation maps in a, b were created in the KNMI Climate Explorer (https://climexp.knmi.nl)
Fig. 3
Fig. 3
Summer NAJ reconstruction and variance. The reconstruction of the latitudinal position of the August NAJ was scaled and calibrated against NAJ position calculated based on twentieth century reanalysis data and explains 40% of its variance over the period of overlap (1920–1978; a). The NCEP/NCAR reanalysis data (1948–2016) are plotted for comparison in a. The full NAJ reconstruction (1725–1978) including combined error estimations is plotted in b. Running 31-year window number of NAJ anomalies (c), number of northern (N) and southern (S) NAJ anomalies (d), and persistence of anomalies (e) are plotted on the central year of the window for reconstructed (blue) and 20C Reanalysis (red) NAJ time series. Anomalies are defined as years when NAJ >1 stdev, with standard deviation calculated based on a merged time series of reconstructed (1725–1919) and 20C Reanalysis (1920–1978) NAJ values. Horizontal dashed lines in ce represent the highest 31-year values over the reconstruction period (1725–1978)
Fig. 4
Fig. 4
NAJ positions during historical weather extremes and volcanic eruptions. Superposed epoch analyses (SEA) of NW Europe climate (a), SE Europe fire (b), North American temperature (c), and volcanic eruptions (d) event series with August NAJ reconstruction. Event series used are the England-Wales summer (June–August) precipitation (a; 1766–2014) and Central England summer temperature (a; 1725–2014) time series, the Netherlands summer temperature time series (a; 1725–2000), a tree-ring-based fire record from Mt. Taygetos, Greece (b; 1823–1940), August temperature data from four meteorological stations in North America (Supplementary Fig. 1) with records dating back to the nineteenth century (c), and an ice-core-based volcanic event series (d; n = 25, 1725–1900). Filled symbols indicate statistical significance (p < 0.05). Event years in a and c are defined as >1.5 stdev (upward triangle) and <1.5 stdev (downward triangle) of the average of the time series. The analysis window includes up to 5 years before and after each event year
Fig. 5
Fig. 5
Late twentieth century variance increase in North Atlantic and North Pacific Basin. Running (31-year window) coefficients of variance of August NAJ time series (g) are compared to time series of observed (a) and modeled (b) quasi-resonant amplification (QRA) fingerprint, of reconstructed zonal and meridional flow in the North Pacific (c), and of variance in the climate dynamics of the North (d, e) and Central (f) Pacific. Variance time series include the Pacific storm track (31-year standard deviation; d), California Current Winter Index (CCWI; 31-year standard deviation; e), and NIÑO4 SST index (31-year variance; f). The late twentieth century increased variance period (1960–present) is highlighted in gray. Horizontal dashed line in g represents the highest 31-year values over the reconstruction period (1725–1978 CE)

References

    1. Screen JA, Simmonds I. Amplified mid-latitude planetary waves favour particular regional weather extremes. Nat. Clim. Change. 2014;4:704–709. doi: 10.1038/nclimate2271. - DOI
    1. Coumou D, Rahmstorf S. A decade of weather extremes. Nat. Clim. Change. 2012;2:491–496.
    1. Mahlstein I, Martius O, Chevalier C, Ginsbourger D. Changes in the odds of extreme events in the Atlantic basin depending on the position of the extratropical jet. Geophys. Res. Lett. 2012;39:L22805.
    1. Stadtherr L, Coumou D, Petoukhov V, Petri S, Rahmstorf S. Record Balkan floods of 2014 linked to planetary wave resonance. Sci. Adv. 2016;2:e1501428. doi: 10.1126/sciadv.1501428. - DOI - PMC - PubMed
    1. Woollings T, Czuchnicki C, Franzke C. Twentieth century North Atlantic jet variability. Q. J. R. Meteorol. Soc. 2014;140:783–791. doi: 10.1002/qj.2197. - DOI

Publication types

LinkOut - more resources