. 2018 Jan 12;8(1):666.
doi: 10.1038/s41598-017-18097-0.

Anti-correlated cortical networks arise from spontaneous neuronal dynamics at slow timescales

Affiliations

Anti-correlated cortical networks arise from spontaneous neuronal dynamics at slow timescales

Nathan X Kodama et al. Sci Rep. .

Abstract

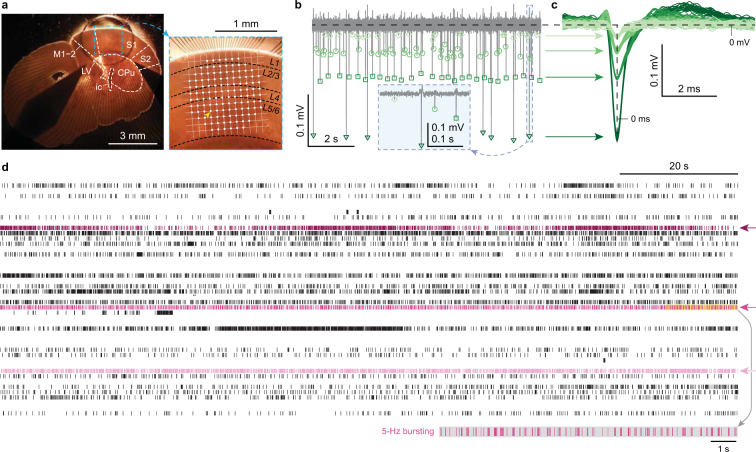
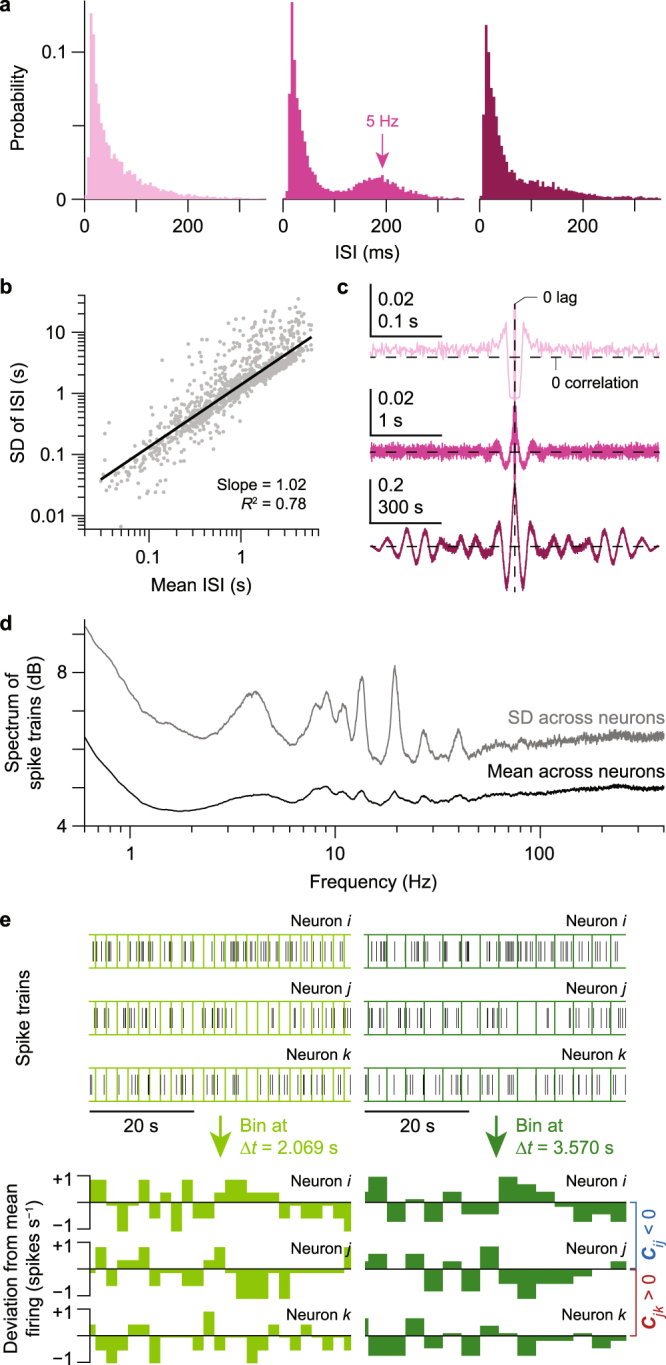
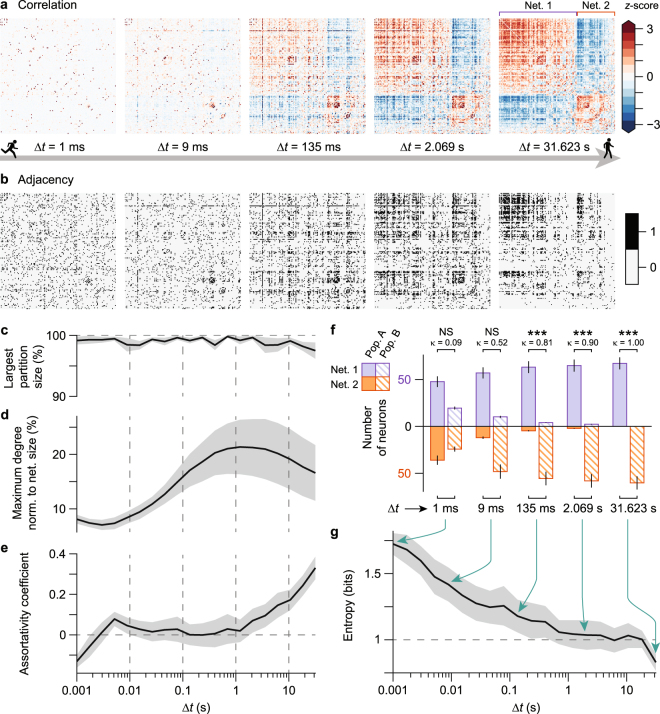
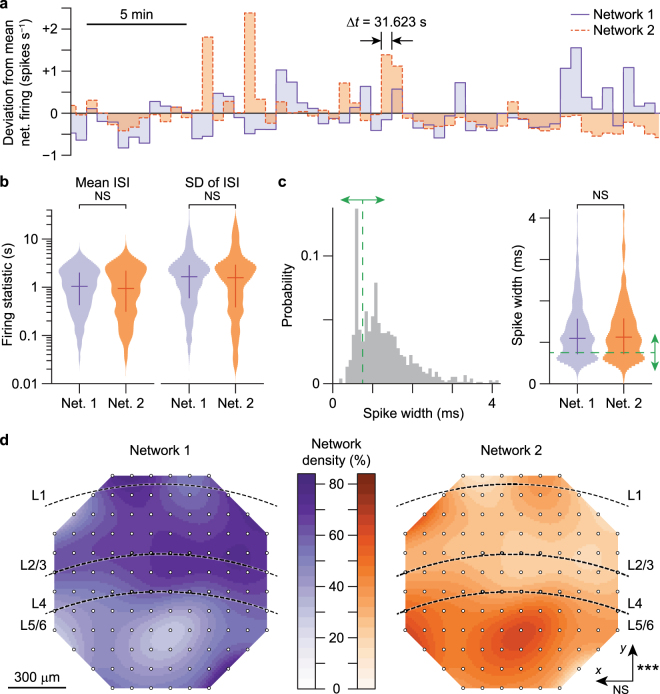
In the highly interconnected architectures of the cerebral cortex, recurrent intracortical loops disproportionately outnumber thalamo-cortical inputs. These networks are also capable of generating neuronal activity without feedforward sensory drive. It is unknown, however, what spatiotemporal patterns may be solely attributed to intrinsic connections of the local cortical network. Using high-density microelectrode arrays, here we show that in the isolated, primary somatosensory cortex of mice, neuronal firing fluctuates on timescales from milliseconds to tens of seconds. Slower firing fluctuations reveal two spatially distinct neuronal ensembles, which correspond to superficial and deeper layers. These ensembles are anti-correlated: when one fires more, the other fires less and vice versa. This interplay is clearest at timescales of several seconds and is therefore consistent with shifts between active sensing and anticipatory behavioral states in mice.


Conflict of interest statement

The authors declare that they have no competing interests.

Figures

Figure 1
Figure 1
From multichannel electrophysiology to high-dimensional neuronal activity. (a) Coronal slice of the murine somatosensory cortex; a high density microelectrode array (white dots) was tangentially aligned with the pia. S1, primary somatosensory cortex; S2, secondary somatosensory cortex; M1–2, primary and secondary motor cortices; LV, lateral ventricle; ic, internal capsule; CPu, caudoputamen; L1–6, cortical layers. (b) Extracellular action potentials recorded from the L5/6 electrode marked by the yellow arrowhead in a. Inset, high temporal resolution of recording enables precise spike detection. (c) Action potential waveforms from a single electrode cluster into different groups, corresponding to different neurons. (d) Raster plot of spiking patterns from multiple (n = 46) neurons recorded simultaneously reveals diversity both in time and across neurons. Magenta arrows highlight a neuron with slowly modulated firing (dark magenta), a neuron bursting at 5 Hz (medium magenta), and a fast tonically firing neuron (light magenta). Inset, neuron bursting at 5 Hz.
Figure 2
Figure 2
Diversity in spontaneous neural activity. (a) Interspike interval (ISI) histograms of three neurons highlighted in Fig. 1d from a single mouse. Multimodality in the distributions, such as the 5-Hz peak indicated in the second histogram, points to bursting patterns. (b) Power law between mean ISI and standard deviation (standard deviation) of ISI (n = 1,196 neurons from seven mice) with an exponent of ~1 demonstrates that spontaneous firing is super-Poissonian. Solid black line shows linear fit between log10 of mean ISI and log10 of standard deviation of ISI; R2 value of this fit is reported (P < 2 × 10−308, linear regression), and slope of this line corresponds to the exponent of the power law. (c) Auto-correlograms of spike trains from three selected neurons display oscillations over time, indicating firing rate modulation at multiple timescales (note the different time axes). (d) Mean spectrum of spike trains (black trace) and its standard deviation (gray trace) across experiments (n = 1,196 neurons from seven mice) reveal multiple frequency bands of spontaneous activity. (e) Spike train binning for three representative neurons from the same experiment, for two different bin widths (∆t). Green traces, time series of mean-subtracted binned spike counts normalized by ∆t. Series from neurons i and j are negatively correlated, and those from neurons j and k are positively correlated.
Figure 3
Figure 3
Network connectivity and graph analyses reveal anti-correlated networks at slow timescales. (a) Correlation matrices of binned spike counts of n = 149 neurons from a single mouse, at five selected timescales (∆t). Correlation values were normalized by their z-score at each timescale. Towards slower timescales, neuronal connections are stronger and denser, and shape up into two mutually exclusive, anti-correlated networks (Net. 1, Net. 2). (b) Binary adjacency matrices computed as either highly significant (1) or non-significant (0) pairwise correlations from correlation matrices in a at each timescale. Adjacency matrix at each timescale thus defines an undirected graph of neuronal connectivity (see Connectivity and graph analysis in Methods). (ce) Graph theoretic measures computed from adjacency matrices in b. Norm., normalized. (f) At each timescale, the anti-correlated component analysis (ACA, see Methods) identifies two neuronal populations (Pop. A, Pop. B) that overlap with the two anti-correlated networks (Net. 1, Net. 2) respectively. The overlap decreases at faster timescales. NS, not significant; ***P < 0.001 (Cohen’s kappa test for inter-rater agreement). (g) Entropy of the contingency table in f demonstrates increasing order at progressively slower timescales. Largest entropy is attained at the fastest timescale of ∆t = 1 ms. Data are shown as mean ± s.e.m. across six mice in cg.
Figure 4
Figure 4
Anti-correlated cortical networks have preferential localization and are heterogeneously composed. (a) Fluctuations in mean neuronal activity of Networks 1 and 2 (n = 149 neurons from a single mouse) are anti-correlated over time. (bc) Neurons (n = 764 neurons from six mice) in each anti-correlated network are equally heterogeneous in terms of (b) firing statistics and (c) spike widths. Bimodal spike width distributions identify neurons with narrow or broad spikes (green arrows), which putatively correspond to inhibitory and excitatory neurons, respectively. Crosses in violins in bc show medians (horizontal lines) and first/third quartiles (vertical lines) of distributions. NS, not significant (Wilcoxon rank-sum test for equal medians, and Kolmogorov-Smirnov (KS) tests for equal distributions). (d) Neuronal density maps (n = 764 neurons from six mice) of the anti-correlated networks demonstrate differential bias to superficial and deep cortical layers (P = 1 × 10−10, KS test for equal distributions in neuron counts across y-axis), but not to the orthogonal dimension (P = 0.22, KS test for equal distributions in neuron counts across x-axis). NS, not significant; ***P < 0.001 (KS tests for equal distributions in neuron counts over the array electrodes).

References

    1. Tsodyks M, Kenet T, Grinvald A, Arieli A. Linking spontaneous activity of single cortical neurons and the underlying functional architecture. Science. 1999;286:1943–1946. doi: 10.1126/science.286.5446.1943. - DOI - PubMed
    1. Galán, R. F. On how network architecture determines the dominant patterns of spontaneous neural activity. PLoS One3, (2008). - PMC - PubMed
    1. Sadovsky AJ, MacLean JN. Scaling of Topologically Similar Functional Modules Defines Mouse Primary Auditory and Somatosensory Microcircuitry. J. Neurosci. 2013;33:14048–14060. doi: 10.1523/JNEUROSCI.1977-13.2013. - DOI - PMC - PubMed
    1. Beggs JM, Plenz D. Neuronal Avalanches in Neocortical Circuits. J. Neurosci. 2003;23:11167–11177. - PMC - PubMed
    1. Ito S, et al. Large-scale, high-resolution multielectrode-array recording depicts functional network differences of cortical and hippocampal cultures. PLoS One. 2014;9:e105324. doi: 10.1371/journal.pone.0105324. - DOI - PMC - PubMed

Publication types

LinkOut - more resources