. 2018 Jan 12;8(1):684.
doi: 10.1038/s41598-017-19043-w.

FDXR is a biomarker of radiation exposure in vivo

Affiliations

FDXR is a biomarker of radiation exposure in vivo

Gráinne O'Brien et al. Sci Rep. .

Abstract

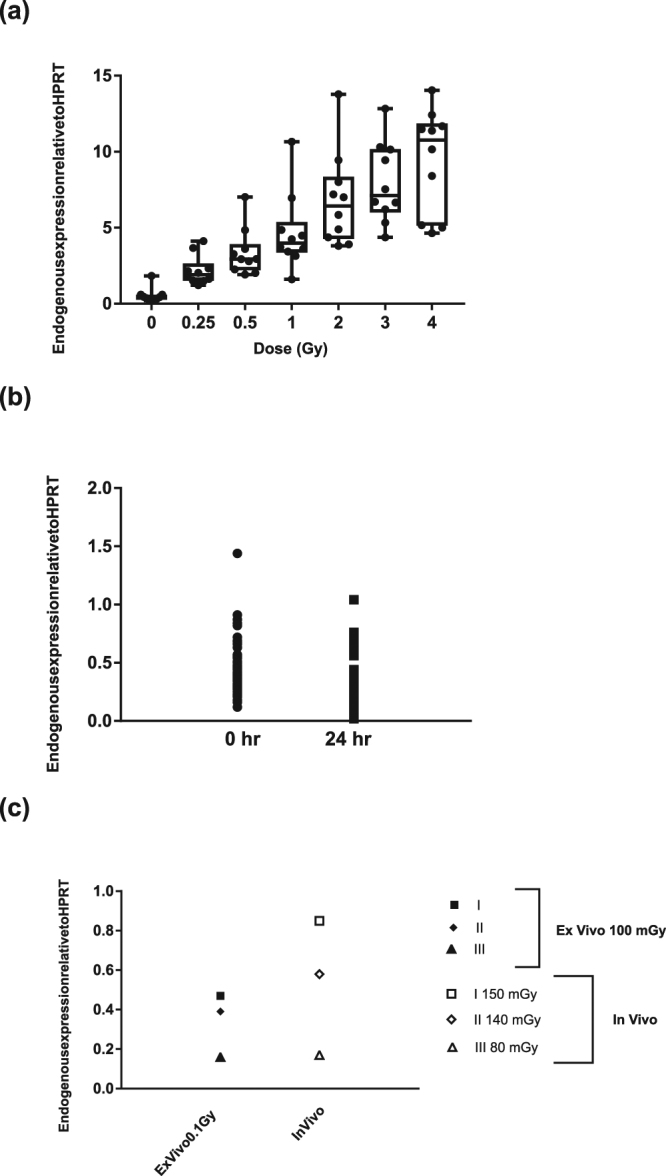
Previous investigations in gene expression changes in blood after radiation exposure have highlighted its potential to provide biomarkers of exposure. Here, FDXR transcriptional changes in blood were investigated in humans undergoing a range of external radiation exposure procedures covering several orders of magnitude (cardiac fluoroscopy, diagnostic computed tomography (CT)) and treatments (total body and local radiotherapy). Moreover, a method was developed to assess the dose to the blood using physical exposure parameters. FDXR expression was significantly up-regulated 24 hr after radiotherapy in most patients and continuously during the fractionated treatment. Significance was reached even after diagnostic CT 2 hours post-exposure. We further showed that no significant differences in expression were found between ex vivo and in vivo samples from the same patients. Moreover, potential confounding factors such as gender, infection status and anti-oxidants only affect moderately FDXR transcription. Finally, we provided a first in vivo dose-response showing dose-dependency even for very low doses or partial body exposure showing good correlation between physically and biologically assessed doses. In conclusion, we report the remarkable responsiveness of FDXR to ionising radiation at the transcriptional level which, when measured in the right time window, provides accurate in vivo dose estimates.


Conflict of interest statement

The authors declare that they have no competing interests.

Figures

Figure 1
Figure 1
Graphic representation of exposure areas of each patient sub-group; Total body irradiation (TBI), head and neck cancer, cardiac fluoroscopy, lung cancer, breast cancer, endometrial cancer and prostate cancer (left) and computed tomography (CT) sub-groups of head chest, chest-abdomen-pelvis and abdomen-pelvis (right). Human body outlines were obtained from wikimedia. Human body outline image by Priyanka250696 (Own work) [CC BY-SA 4.0 (https://creativecommons.org/licenses/by-sa/4.0)], via Wikimedia Commons.
Figure 2
Figure 2
Transcriptional FDXR gene expression changes in peripheral blood samples from (a) TBI patients (6 patients), (b) endometrial cancer radiotherapy patients (12 patients), (c) prostate cancer radiotherapy patients (10 patients), (d) lung cancer radiotherapy patients (2 patients), (e) head and neck cancer radiotherapy patients (8 patients), (f) breast cancer radiotherapy patients (4 patients), (g) patients undergoing cardiac fluoroscopy (5 patients) and (h) patients undergoing diagnostic CT (10 patients), before radiation exposure and at different times post-exposure with each symbol representing one patient. Expression is relative to HPRT gene. Statistical analyses were performed in log transformed data. Significant differences (Paired-T-test, p ≤ 0.05) with the control were indicated with an asterisk (*). Arrows indicate time of irradiation.
Figure 3
Figure 3
Comparison of FDXR expression in blood in in vivo and ex vivo irradiated samples. (a) The box plot shows MQRT-PCR gene expression changes in FDXR expression in ex vivo irradiated blood from 10 normal healthy human blood donors 24 hr after irradiation with 0, 0.25, 0.5, 1, 2, 3 and 4 Gy x-rays. Expression is relative to HPRT gene. (b) FDXR expression at 0 hr in 82 healthy human donors and in blood kept ex vivo at 37 °C for 24 hr in 39 healthy human donors. (c) Comparison of FDXR expression at 24 hr in blood irradiated ex vivo and in vivo from three donors. For ex vivo samples, FDXR expression is presented 24 hr after ex vivo irradiation with 100 mGy in blood samples taken pre-exposure from the same patients. For in vivo samples, FDXR expression is presented 24 hr after the first radiotherapy fraction dose where cancer patients were irradiated with blood doses of 150 mGy for patient I, 140 mGy for patient II and 80 mGy for patient III.
Figure 4
Figure 4
Comparison of dose estimates from 2 independent laboratories of blood samples from endometrial cancer patients before radiotherapy and 24 hr after the first fraction of 1.8 Gy.
Figure 5
Figure 5
Gene expression of FDXR in human blood irradiated and/or stimulated with LPS and curcumin ex vivo. Blood from 10 donors was incubated with two different concentration of LPS (1 or 500 ng ml-1) or curcumin (15 µM) 1 hr before irradiation (2 Gy) or just after irradiation (only for LPS). Transcriptional expression of FDXR was analysed at 2 hr (a) and 24 hr post-irradiation (b). Data are shown as mean ± SD (n = 10, black symbols indicate five women and white symbols five men). Statistical analyses were performed on log transformed data. Significant differences (Paired-T-test, p ≤ 0.05) with the control were indicated with an asterisk (*) and differences with IR with a hash (#) (only for IR groups).
Figure 6
Figure 6
FDXR mRNA endogenous expression in blood samples from patients exposed to a variable range of radiation doses. Patient groups include TBI, endometrial cancer, head and neck cancer, breast cancer, prostate cancer, lung cancer and patients undergoing diagnostic CT. All samples were taken at 24 hr after radiation exposure. The data are represented on a log transformed scale with a linear fit and R2 and p values plotted.
Figure 7
Figure 7
FDXR calculated dose estimates in blood samples from cancer radiotherapy patients and diagnostic CT procedures exposed to a variable range of radiation doses. Patient groups include TBI, endometrial cancer, head and neck cancer, breast cancer, prostate cancer, lung cancer and diagnostic CT patients. All samples were taken at 24 hr after radiation exposure. The data represent the standard error of mean (SEM) of the biological dose estimates (y axis) and of the physical dose estimates (x axis) on a log transformed scale with a linear fit and R2 and p values plotted.

References

    1. Amundson SA, et al. Identification of potential mRNA biomarkers in peripheral blood lymphocytes for human exposure to ionizing radiation. Radiat Res. 2000;154:342–346. doi: 10.1667/0033-7587(2000)154[0342:IOPMBI]2.0.CO;2. - DOI - PubMed
    1. Dressman HK, et al. Gene expression signatures that predict radiation exposure in mice and humans. PLoS Med. 2007;4:e106. doi: 10.1371/journal.pmed.0040106. - DOI - PMC - PubMed
    1. Paul S, Amundson SA. Development of gene expression signatures for practical radiation biodosimetry. Int J Radiat Oncol Biol Phys. 2008;71:1236–1244. doi: 10.1016/j.ijrobp.2008.03.043. - DOI - PMC - PubMed
    1. Lu TP, Hsu YY, Lai LC, Tsai MH, Chuang EY. Identification of gene expression biomarkers for predicting radiation exposure. Sci Rep. 2014;4:6293. doi: 10.1038/srep06293. - DOI - PMC - PubMed
    1. Berglund SR, et al. Transient genome-wide transcriptional response to low-dose ionizing radiation in vivo in humans. Int J Radiat Oncol Biol Phys. 2008;70:229–234. doi: 10.1016/j.ijrobp.2007.09.026. - DOI - PMC - PubMed

Publication types

LinkOut - more resources