. 2018 Jan 12;8(1):685.
doi: 10.1038/s41598-017-19100-4.

Single-cell RNA-sequencing resolves self-antigen expression during mTEC development

Affiliations

Single-cell RNA-sequencing resolves self-antigen expression during mTEC development

Ricardo J Miragaia et al. Sci Rep. .

Abstract

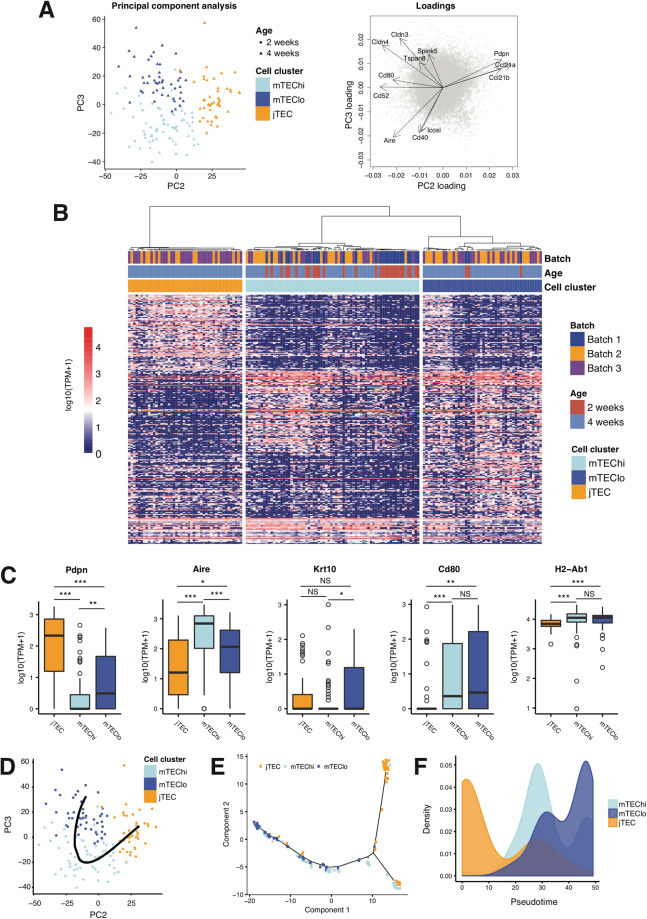
The crucial capability of T cells for discrimination between self and non-self peptides is based on negative selection of developing thymocytes by medullary thymic epithelial cells (mTECs). The mTECs purge autoreactive T cells by expression of cell-type specific genes referred to as tissue-restricted antigens (TRAs). Although the autoimmune regulator (AIRE) protein is known to promote the expression of a subset of TRAs, its mechanism of action is still not fully understood. The expression of TRAs that are not under the control of AIRE also needs further characterization. Furthermore, expression patterns of TRA genes have been suggested to change over the course of mTEC development. Herein we have used single-cell RNA-sequencing to resolve patterns of TRA expression during mTEC development. Our data indicated that mTEC development consists of three distinct stages, correlating with previously described jTEC, mTEChi and mTEClo phenotypes. For each subpopulation, we have identified marker genes useful in future studies. Aire-induced TRAs were switched on during jTEC-mTEC transition and were expressed in genomic clusters, while otherwise the subsets expressed largely overlapping sets of TRAs. Moreover, population-level analysis of TRA expression frequencies suggested that such differences might not be necessary to achieve efficient thymocyte selection.


Conflict of interest statement

The authors declare that they have no competing interests.

Figures

Figure 1
Figure 1
Experimental workflow and expression of tissue-restricted antigens on population level. (A) Experimental workflow: mTECs in single-cell suspension were sorted to be run in Fluidigm C1 system. (B) Quality control of scRNA-seq for all 3 batches of cells processed with the Fluidigm C1 system based on number of genes detected, percentage of mitochondrial reads and number of mapped reads. Each batch corresponds to a different colour, and the age of the mice used match the shapes. (C) Number of expressed genes vs number of expressed TRAs in each cell. (D) Number of expressed genes as a function of the number of mTECs considered. Each point was calculated based on the average of 100 random orders of the 692 cells of all datasets analysed. (E) Comparing genes from different categories in terms of expression frequency and mean expression level across all cells. ***p-value < 0.001, **p-value < 0.01, *p-value < 0.05, NS – not significant, according to Mann-Whitney-Wilcoxon test, p-value adjusted using Bonferroni correction.
Figure 2
Figure 2
Analyses of mTEC subpopulation structure. (A) Principal Component Analysis (PCA) of mTECs using all genes. Batches match colour and age of mice matches shapes (left). The PC2 and PC3 loadings of key genes of interest are highlighted (right). (B) Hierarchical clustering of 164 transcriptomes of single-cells, based on the top positively and inversely correlated genes with PC2 and PC3. Three clusters of cells were identified (jTEC, mTEChi and mTEClo). Cell cluster, mice age and batch are depicted. (C) Expression of selected marker genes in the jTEC, mTEChi, and mTEClo populations. ***p-value < 0.001, **p-value < 0.01, *p-value < 0.05, NS – not significant, according to Mann-Whitney-Wilcoxon test, p-value adjusted using Bonferroni correction. (D) Ordering of single cells in pseudotime by degree of maturation using the pseudogp algorithm. Data points represent single cells, colours denoting cell clusters (B). (E) Ordering of single cells in pseudotime using the Monocle2 algorithm. Data points represent single cells, colours denoting cell clusters (B). (F) Distribution of single cells of each cluster (B) along Monocle2 pseudotime (E).
Figure 3
Figure 3
Differential expression of genes across mTEC subpopulations. (A) Genes differentially expressed (DE) between each cell population and the remaining populations. The significance of this DE was calculated using a linear model. q-value < 0.01 and |FC| > 1. (B) Scaled median expression levels of transcription factors with enriched binding motifs (C) across jTEC, mTEChi and mTEClo subpopulations. The TFs were grouped according to TF families, as denoted by the color bar. (C) Network visualisation of TFs and their putative target genes. Target genes were identified by binding motif analysis using gProfileR (Methods). The results were further filtered based on co-expression, based on Spearman correlation and Jaccard index (Methods). Colours of the nodes denote TF families, as shown in (B). Thicker and darker edges represent higher Spearman correlation.
Figure 4
Figure 4
Expression of TRAs across mTEC subpopulations. (A) The detection of TRA genes across jTEC, mTEChi, and mTEClo populations. The numbers indicate the fraction of TRAs detected in the respective subset of cells. (B) Number of TRA genes expressed in the jTEC, mTEChi, and mTEClo populations. To account for differences in library sizes, the number of detected TRA genes were normalised to the number of detected genes per cell. ***p-value < 0.001, **p-value < 0.01, *p-value < 0.05, NS – not significant, according to Mann-Whitney-Wilcoxon test, p-value adjusted using Bonferroni correction. (C) Genomic distribution of expressed TRAs. Histograms represent distribution of distance to the nearest neighbour gene for TRA genes. The background histograms represent the distribution of distances to the nearest neighbour of randomly sampled expressed genes from a control distribution (Methods) in the corresponding cell.

References

    1. Perry JS, Hsieh CS. Development of T-cell tolerance utilizes both cell-autonomous and cooperative presentation of self-antigen. Immunol Rev. 2016;271:141–155. doi: 10.1111/imr.12403. - DOI - PMC - PubMed
    1. Otero DC, Baker DP, David M. IRF7-dependent IFN-β production in response to RANKL promotes medullary thymic epithelial cell development. J Immunol. 2013;190:3289–3298. doi: 10.4049/jimmunol.1203086. - DOI - PMC - PubMed
    1. Xing, Y. & Hogquist, K. A. T-cell tolerance: central and peripheral. Cold Spring Harb Perspect Biol4, 10.1101/cshperspect.a006957 (2012). - PMC - PubMed
    1. Klein L, Kyewski B, Allen PM, Hogquist KA. Positive and negative selection of the T cell repertoire: what thymocytes see (and don’t see) Nat Rev Immunol. 2014;14:377–391. doi: 10.1038/nri3667. - DOI - PMC - PubMed
    1. Aschenbrenner K, et al. Selection of Foxp3+ regulatory T cells specific for self antigen expressed and presented by Aire + medullary thymic epithelial cells. Nat Immunol. 2007;8:351–358. doi: 10.1038/ni1444. - DOI - PubMed

Publication types

MeSH terms

LinkOut - more resources