

Motor skill learning and reward consumption differentially affect VTA activation
- PMID: 29330488
- PMCID: PMC5766527
- DOI: 10.1038/s41598-017-18716-w
Motor skill learning and reward consumption differentially affect VTA activation
Abstract
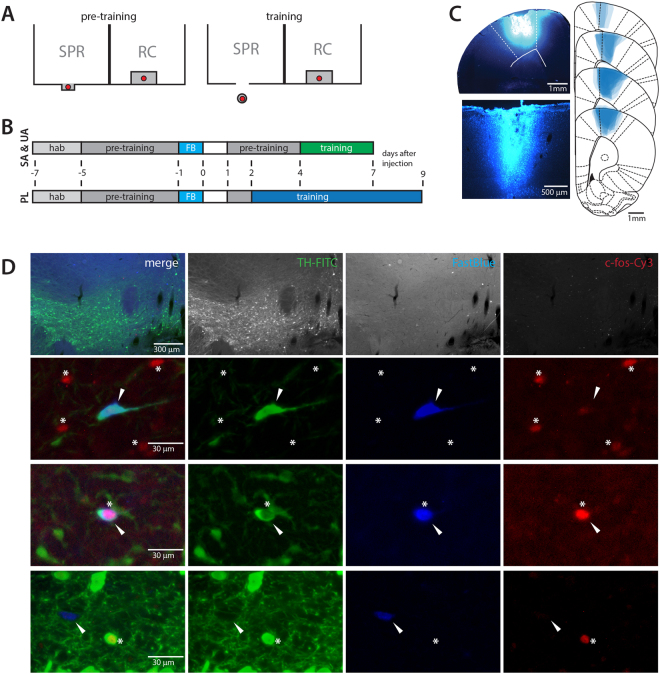
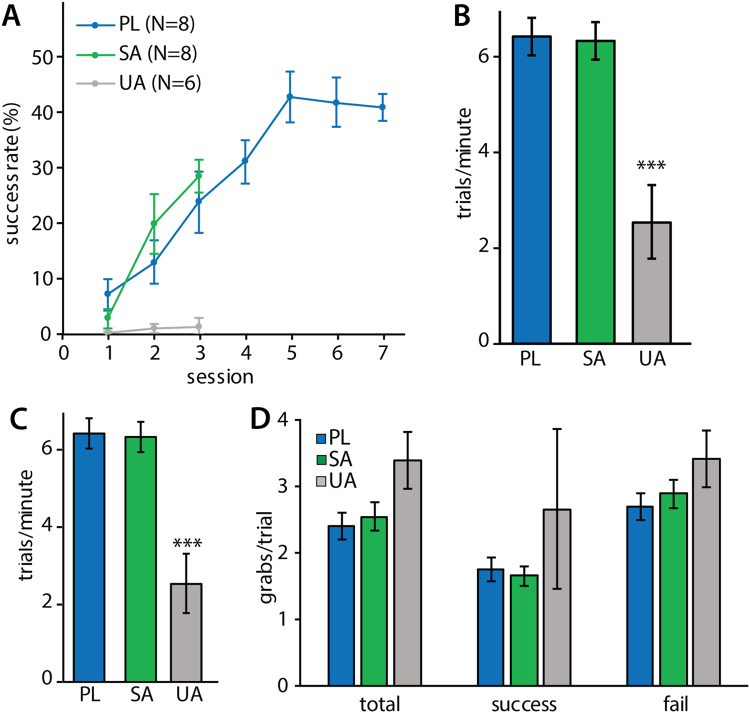
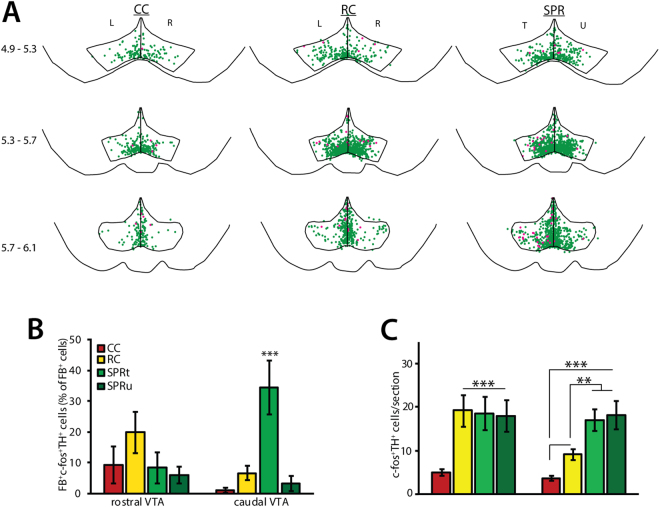
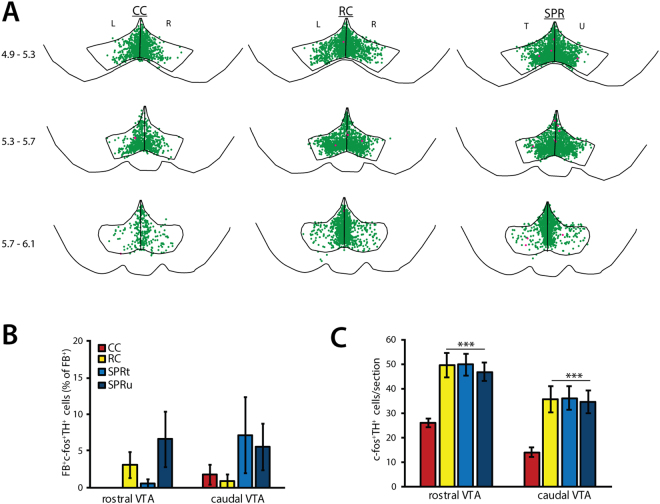
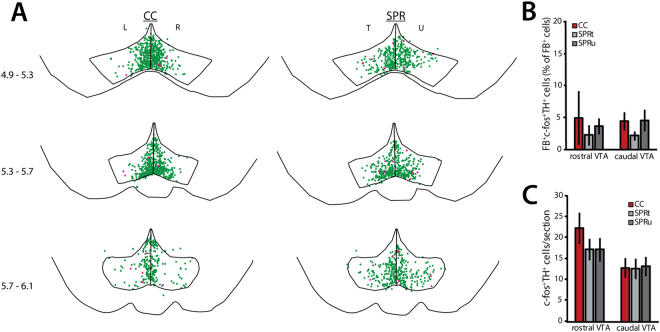
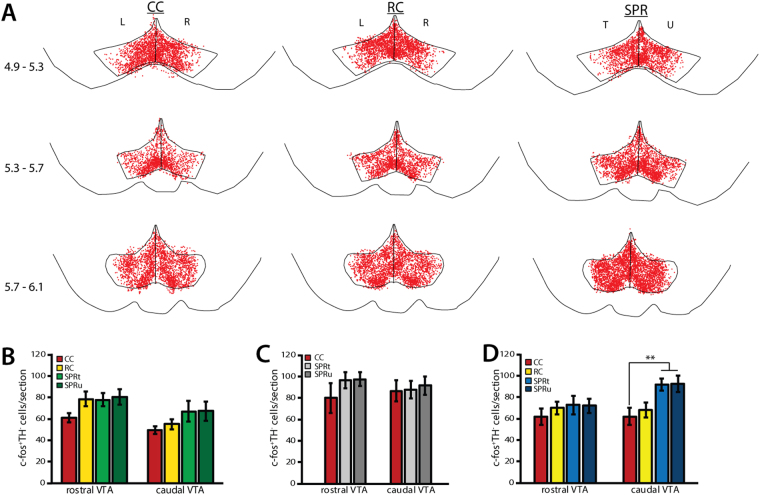
Dopamine release from the ventral tegmental area (VTA) terminals in the primary motor cortex (M1) enables motor skill acquisition. Here, we test the hypothesis that dopaminergic VTA neurons projecting to M1 are activated when rewards are obtained during motor skill acquisition, but not during task execution at plateau performance, or by rewards obtained without performing skilled movements. Rats were trained to perform a skilled reaching task for 3 days (acquisition) or 7 days (plateau). In combination with retrograde labelling of VTA-to-M1 projection neurons, double immunofluorescence for c-fos and tyrosine hydroxylase (TH) was used to assess activation of dopaminergic and non-dopaminergic VTA neurons. Dopaminergic VTA-to-M1 projection neurons were indeed activated during successful motor skill acquisition, but not when rats failed to learn or had reached plateau performance, nor by food rewards alone. By contrast, dopaminergic VTA neurons that did not project to M1 were activated by both skilled reaching and food rewards. Non-dopaminergic neurons were found to be activated by motor task performance at plateau, but not during skill acquisition. These results indicate that distinct populations of VTA neurons are activated by motor skill acquisition and task performance. Moreover, this activation is not merely related to consumption of food rewards.
Conflict of interest statement
The authors declare that they have no competing interests.
Figures
Similar articles
-
Dopaminergic projections from midbrain to primary motor cortex mediate motor skill learning.J Neurosci. 2011 Feb 16;31(7):2481-7. doi: 10.1523/JNEUROSCI.5411-10.2011. J Neurosci. 2011. PMID: 21325515 Free PMC article.
-
A food-associated CS activates c-Fos in VTA DA neurons and elicits conditioned approach.Behav Brain Res. 2012 Dec 1;235(2):150-7. doi: 10.1016/j.bbr.2012.07.044. Epub 2012 Aug 7. Behav Brain Res. 2012. PMID: 22963991
-
Topography and collateralization of dopaminergic projections to primary motor cortex in rats.Exp Brain Res. 2015 May;233(5):1365-75. doi: 10.1007/s00221-015-4211-2. Epub 2015 Jan 30. Exp Brain Res. 2015. PMID: 25633321
-
Dopaminergic signals in primary motor cortex.Int J Dev Neurosci. 2009 Aug;27(5):415-21. doi: 10.1016/j.ijdevneu.2009.05.004. Epub 2009 May 14. Int J Dev Neurosci. 2009. PMID: 19446627 Review.
-
Dopaminergic meso-cortical projections to m1: role in motor learning and motor cortex plasticity.Front Neurol. 2013 Oct 7;4:145. doi: 10.3389/fneur.2013.00145. Front Neurol. 2013. PMID: 24109472 Free PMC article. Review.
Cited by
-
Enhanced Population Coding for Rewarded Choices in the Medial Frontal Cortex of the Mouse.Cereb Cortex. 2019 Sep 13;29(10):4090-4106. doi: 10.1093/cercor/bhy292. Cereb Cortex. 2019. PMID: 30615132 Free PMC article.
-
The role of ventral tegmental area in chronic stroke rehabilitation: an exploratory study.Front Neurol. 2023 Dec 5;14:1270783. doi: 10.3389/fneur.2023.1270783. eCollection 2023. Front Neurol. 2023. PMID: 38116106 Free PMC article.
-
Enhancing Post-Stroke Rehabilitation and Preventing Exo-Focal Dopaminergic Degeneration in Rats-A Role for Substance P.Int J Mol Sci. 2022 Mar 31;23(7):3848. doi: 10.3390/ijms23073848. Int J Mol Sci. 2022. PMID: 35409207 Free PMC article.
-
Effects of Voluntary Wheel Running Exercise on Chemotherapy-Impaired Cognitive and Motor Performance in Mice.Int J Environ Res Public Health. 2023 Apr 3;20(7):5371. doi: 10.3390/ijerph20075371. Int J Environ Res Public Health. 2023. PMID: 37047984 Free PMC article.
-
Dopamine D2-Like Receptors Modulate Intrinsic Properties and Synaptic Transmission of Parvalbumin Interneurons in the Mouse Primary Motor Cortex.eNeuro. 2020 May 20;7(3):ENEURO.0081-20.2020. doi: 10.1523/ENEURO.0081-20.2020. Print 2020 May/Jun. eNeuro. 2020. PMID: 32321772 Free PMC article.
References
-
- Ranaldi R. Dopamine and reward seeking: the role of ventral tegmental area. Rev. Neurosci. 2014;25:621–630. - PubMed
Publication types
MeSH terms
Substances
LinkOut - more resources
Full Text Sources
Other Literature Sources
