. 2018 May 1;596(9):1659-1679.
doi: 10.1113/JP275194. Epub 2018 Feb 20.

Preferential cholinergic excitation of corticopontine neurons

Affiliations

Preferential cholinergic excitation of corticopontine neurons

Arielle L Baker et al. J Physiol. .

Abstract

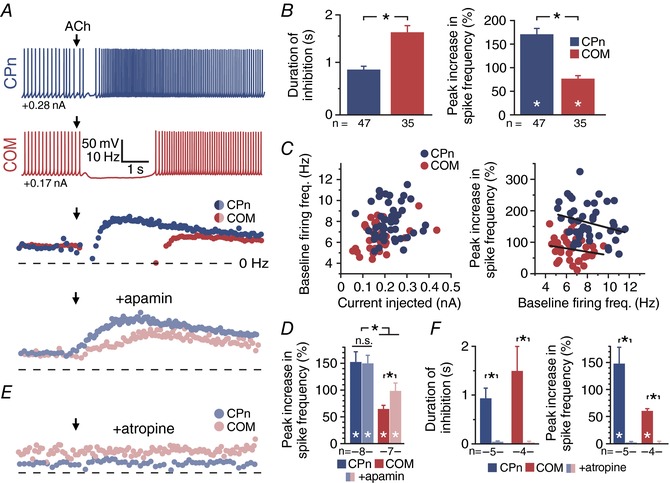
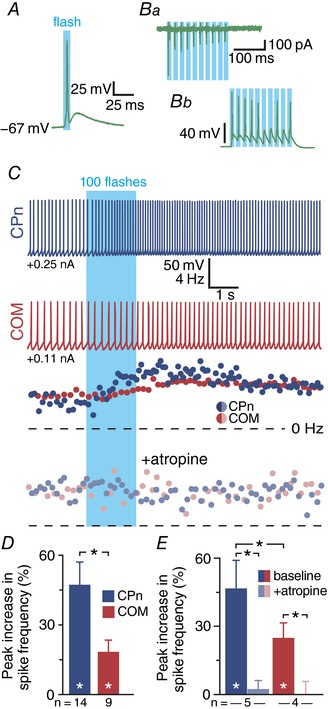
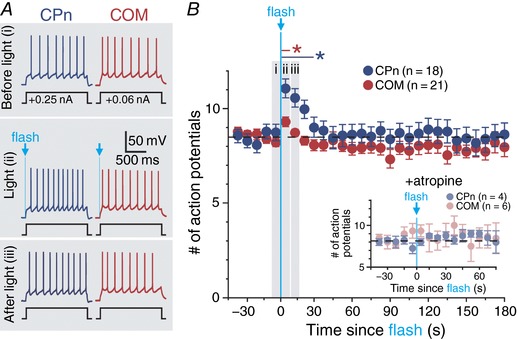
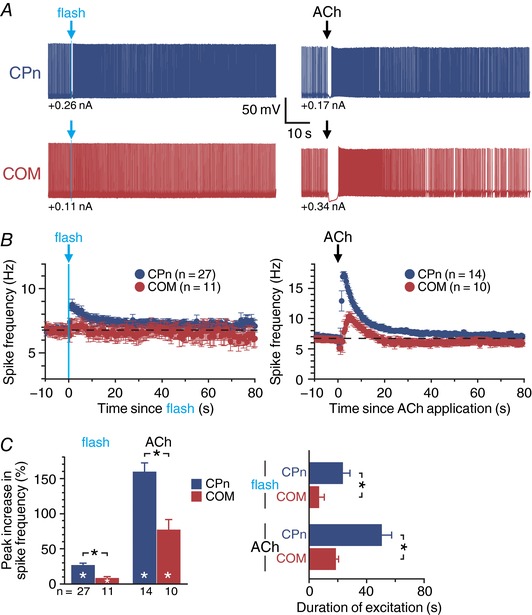
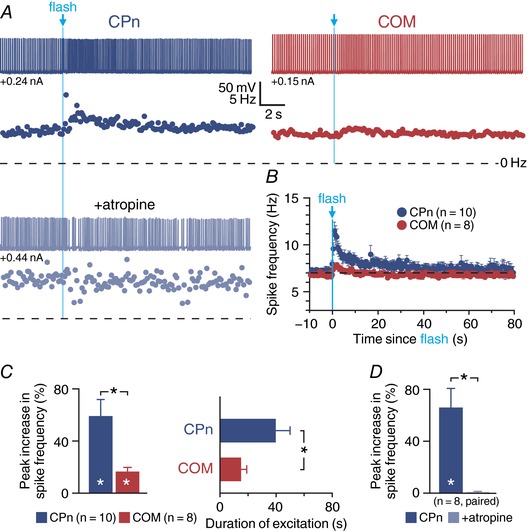
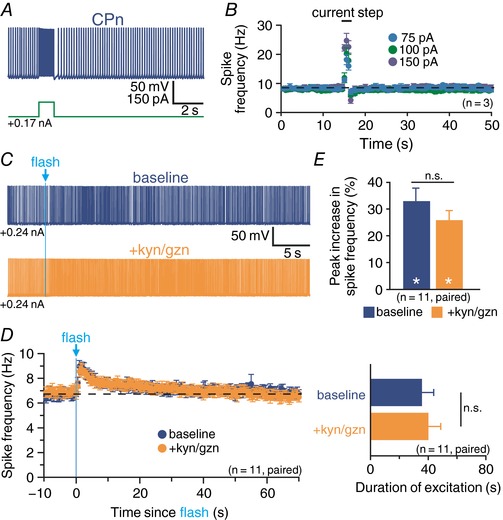
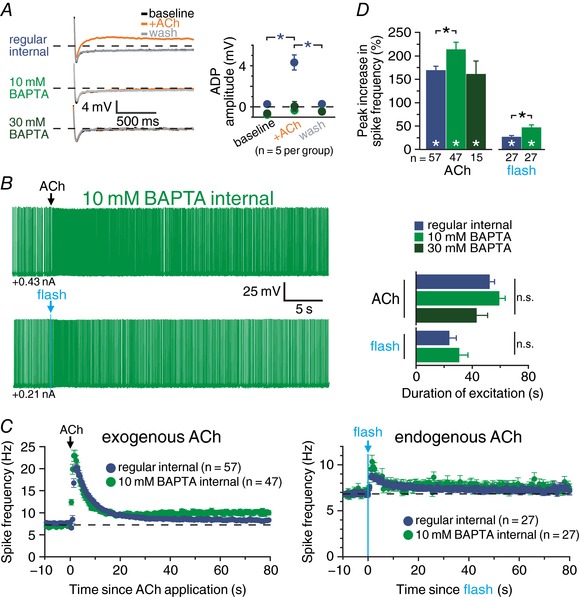
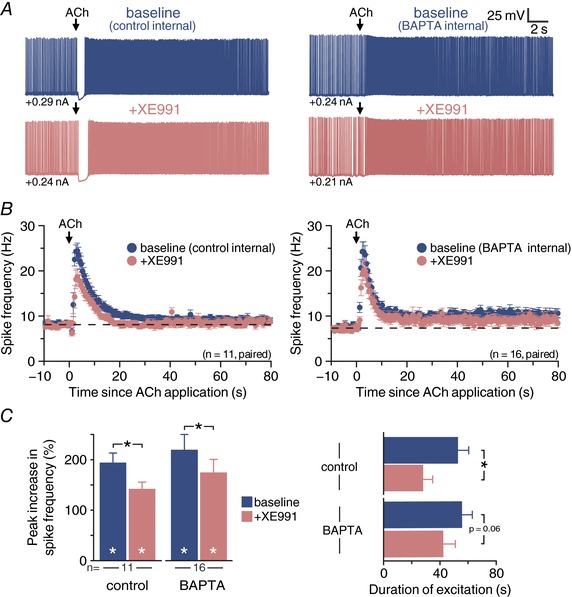
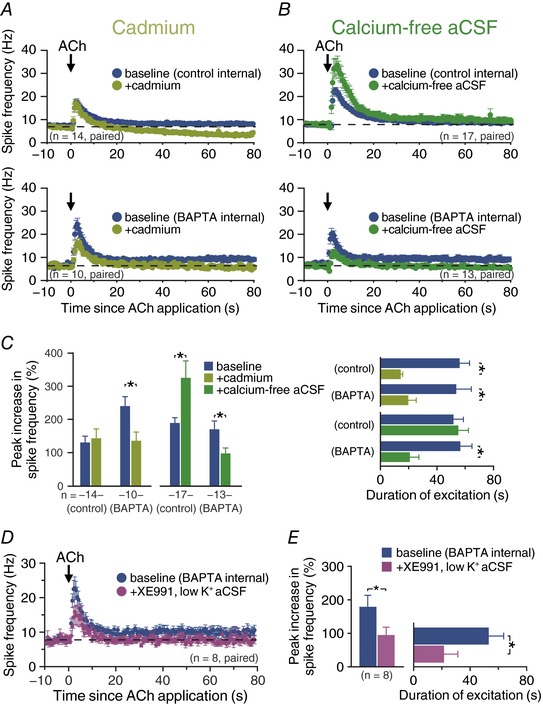
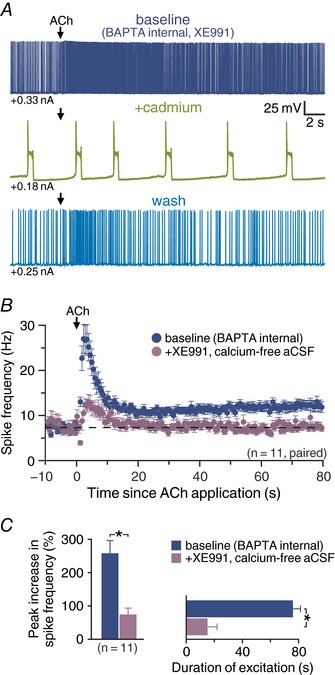
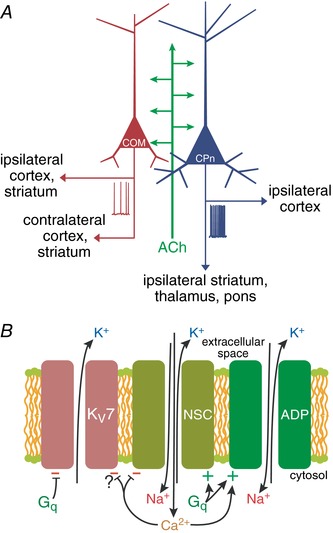
Key points: Phasic activation of M1 muscarinic receptors generates transient inhibition followed by longer lasting excitation in neocortical pyramidal neurons. Corticopontine neurons in the mouse prefrontal cortex exhibit weaker cholinergic inhibition, but more robust and longer lasting excitation, than neighbouring callosal projection neurons. Optogenetic release of endogenous ACh in response to single flashes of light (5 ms) preferentially enhances the excitability of corticopontine neurons for many tens of seconds. Cholinergic excitation of corticopontine neurons involves at least three ionic mechanisms: suppression of KV 7 currents, activation of the calcium-dependent non-specific cation conductance underlying afterdepolarizations, and activation of what appears to be a calcium-sensitive but calcium-permeable non-specific cation conductance. Preferential cholinergic excitation of prefrontal corticopontine neurons may facilitate top-down attentional processes and behaviours.

Abstract: Pyramidal neurons in layer 5 of the neocortex comprise two broad classes of projection neurons: corticofugal neurons, including corticopontine (CPn) neurons, and intratelencephalic neurons, including commissural/callosal (COM) neurons. These non-overlapping neuron subpopulations represent discrete cortical output channels contributing to perception, decision making and behaviour. CPn and COM neurons have distinct morphological and physiological characteristics, and divergent responses to modulatory transmitters such as serotonin and acetylcholine (ACh). To better understand how ACh regulates cortical output, in slices of mouse prefrontal cortex (PFC) we compared the responsivity of CPn and COM neurons to transient exposure to exogenous or endogenous ACh. In both neuron subtypes, exogenous ACh generated qualitatively similar biphasic responses in which brief hyperpolarization was followed by longer lasting enhancement of excitability. However, cholinergic inhibition was more pronounced in COM neurons, while excitatory responses were larger and longer lasting in CPn neurons. Similarly, optically triggered release of endogenous ACh from cholinergic terminals preferentially and persistently (for ∼40 s) enhanced the excitability of CPn neurons, but had little impact on COM neurons. Cholinergic excitation of CPn neurons involved at least three distinct ionic mechanisms: suppression of KV 7 channels (the 'M-current'), activation of the calcium-dependent non-specific cation conductance underlying afterdepolarizations, and activation of what appears to be a calcium-sensitive but calcium-permeable non-specific cation conductance. Our findings demonstrate projection-specific selectivity in cholinergic signalling in the PFC, and suggest that transient release of ACh during behaviour will preferentially promote corticofugal output.

Keywords: acetylcholine; neocortex; pyramidal neuron.


Figures

Figure 1
Figure 1. Exogenous ACh preferentially excites CPn neurons
A, voltage responses of CPn (blue) or COM (red) neurons to focally applied ACh (100 μm) delivered during periods of current‐induced action potential generation (top), with corresponding plots of instantaneous spike frequency (ISF) for each action potential in baseline conditions or after application of apamin (100 nm, below). Dashed line indicates 0 Hz. B, comparisons of the duration of action potential inhibition (left) and the magnitude of excitatory cholinergic responses (right) in CPn (n = 47) and COM (n = 35) neurons. C, plots of baseline firing frequency vs. current injection (left) and peak increase in spike frequency vs. baseline firing frequency (right) for the initial groups of CPn (n = 47, blue) and COM (n = 35, red) neurons featured in B. D, comparison of ACh‐induced peak change in spike frequency before and after blockade of SK channels in CPn (n = 8) and COM (n = 7) neurons. E, plots of ISF for CPn (blue) and COM (red) neurons in the presence of atropine (1 μm). F, comparisons of inhibitory (left) and excitatory (right) responses to ACh before and after atropine treatment in CPn (n = 5) and COM (n = 4) neurons. Asterisks indicate significant differences (P < 0.05): white asterisks indicate significant differences from baseline firing frequencies, and black asterisks indicate significant differences between COM and CPn neurons.
Figure 2
Figure 2. Endogenous ACh preferentially excites CPn neurons
A and B, single flashes of 470 nm light (5 ms) evoked single action potentials in cholinergic neurons (n = 4) in the basal forebrain of ChAT‐ChR2 mice (A), while trains of light flashes (5 ms at 50 Hz) generated multiple action potentials, with some degree of failure, in extracellular recordings (Ba) and in subsequent whole‐cell recordings (Bb; n = 4). C, voltage responses and corresponding spike frequency plots for CPn (blue traces) and COM (red traces) neurons to optical activation consisting of 100 flashes of blue light (5 ms each, at 59 Hz) before (top) and after (bottom) bath application of atropine (1 μm). D, comparison of peak increase in spike frequency in CPn (blue; n = 14) and COM (red; n = 9) neurons. E, comparisons of cholinergic excitation before and after atropine application in a subset of CPn (n = 5) and COM (n = 4) neurons. Asterisks indicate significant differences (P < 0.05): white asterisks indicate significant differences from baseline firing frequencies, and black asterisks indicate significant differences between CPn and COM neurons and between experimental conditions.
Figure 3
Figure 3. Single flash‐evoked release of endogenous ACh preferentially excites CPn neurons
A, periodic somatic current steps (1.5 s) generated 7–8 action potentials in baseline conditions (trial 5) in CPn and COM neurons (top). In both neuron populations, a single flash of blue light (5 ms) applied at the beginning of trial 6 increased the number of action potentials generated (middle), but this enhanced excitability persisted into the following trial (trial 7) only in CPn neurons (bottom). B, plot of the mean number of action potentials generated by periodic current steps in populations of CPn (blue; n = 18) and COM (red; n = 21) neurons over time. Trials 5 (i), 6 (ii) and 7 (iii) are shaded and indicate time points of voltage traces in A. Inset: in a subset of CPn (n = 4) and COM (n = 6) neurons, the presence of atropine (1 μm) blocked flash‐evoked increases in action potential generation. Asterisks indicate significant differences (P < 0.05); blue and red asterisks and lines indicate the duration of significant differences from baseline firing frequencies in CPn and COM neurons, respectively.
Figure 4
Figure 4. Persistence of cholinergic excitation in CPn and COM neurons
A, responses to single flash‐evoked release of endogenous ACh (5 ms flash, left) or exogenous ACh (100 ms, right) in CPn (blue traces; top) and COM (red traces; bottom) neurons. B, plots of mean ISFs over time in populations of neurons exposed to endogenous (CPn, n = 27; COM, n = 11; left) or exogenous (CPn, n = 14; COM, n = 10; right) ACh. C, comparisons of the mean increase in firing frequency following exposure to endogenous and exogenous ACh in CPn and COM neurons (left) and the duration of cholinergic excitation following endogenous or exogenous ACh exposure (right). Asterisks indicate significant differences (P < 0.05): white asterisks indicate significant changes from baseline firing frequencies, and black asterisks indicate significant differences between CPn and COM neurons.
Figure 5
Figure 5. Preferential cholinergic excitation of CPn neurons in an alternative optogenetic model of endogenous ACh release
A, voltage responses (top) and corresponding ISF plots (below) to single‐flash‐evoked release of endogenous ACh in CPn (blue trace, left) and COM (red trace, right) neurons in the mPFC of ChAT‐Cre/Ai32 mice. In the CPn neuron, the flash‐induced increase in firing frequency was eliminated following addition of atropine (1 μm; lower light blue trace and ISF plot). B, plots of mean ISFs during light‐evoked release of endogenous ACh for populations of CPn (blue; n = 10) and COM (red; n = 8) neurons in the mPFC of ChAT‐Cre/Ai32 mice. C, comparisons of the magnitude (left) and duration (right) of peak cholinergic excitation in CPn (n = 10) and COM (n = 8) neurons. D, comparison of ACh response amplitude in a subset of CPn neurons (n = 8) in baseline conditions and after application of atropine. Asterisks indicate significant differences (P < 0.05): white asterisks indicate significant changes from baseline firing frequencies, and black asterisks indicate significant differences between conditions.
Figure 6
Figure 6. Persistence of cholinergic excitation of CPn neurons does not result from intrinsic membrane properties or network activity
A, voltage response of a CPn neuron to a brief current step (100 pA, 1 s) applied during spontaneous action potential generation driven by suprathreshold DC. B, plots of mean ISFs for CPn neurons (n = 3) experiencing transient increases in excitatory drive at the indicated intensities. Note that current‐induced increases in spike frequency return to baseline levels immediately after cessation of the depolarizing step. C, responses to flash‐evoked release of endogenous ACh (5 ms) in a CPn neuron in baseline conditions (blue trace, top) and after block of fast synaptic transmission with kynurenate (kyn; 3 mm) and gabazine (gzn; 10 μm; orange trace, bottom). D, plots of ISF for a population of CPn neurons (n = 11) in baseline conditions (blue) and in the presence of kyn and gzn (orange). E, comparisons of the magnitude (top) or duration (bottom) of peak excitation for 11 CPn neurons in baseline conditions and after addition of kyn and gzn. White asterisks indicate significant differences (P < 0.05) from pre‐flash firing frequencies.
Figure 7
Figure 7. Chelating internal calcium does not reduce cholinergic excitatory responses in CPn neurons
A, pairing three applications of exogenous ACh with 10 current‐driven action potentials led to the generation of afterdepolarizing potentials (ADPs) in a CPn neuron recorded with control internal solution (top traces), but not in neurons filled with 10 mm (middle traces) or 30 mm (bottom traces) BAPTA (left). Quantification of ADP amplitudes before, during and after exposure to ACh in control neurons (blue; n = 5) and neurons filled with 10 mm (light green; n = 5) or 30 mm (dark green; n = 5) BAPTA (right). B, voltage responses to exogenous (top) and endogenous (bottom) ACh in neurons filled with 10 mm BAPTA. C, plots of mean ISFs for populations of CPn neurons in response to exogenous (left) or endogenous (right) ACh recorded with regular internal (blue), 10 mm BAPTA internal (light green), or 30 mm BAPTA internal solution (dark green). D, comparisons of the peak increase in firing frequency (top) or duration of excitation (bottom) in response to exogenous or endogenous ACh in control neurons and neurons filled with 10 or 30 mm BAPTA. Asterisks indicate significant differences (P < 0.05): white asterisks indicate significant changes from baseline firing frequencies, and black asterisks indicate significant differences between conditions.
Figure 8
Figure 8. M‐current contributes to persistent cholinergic excitation of CPn neurons
A, voltage responses to focal application of exogenous ACh (100 ms) in a CPn neuron recorded with control internal (left) or 10 mm BAPTA internal solution (right) in baseline conditions (top, blue) and after addition of the KV7 blocker XE911 (10 μm; bottom, pink). B, plot of mean ISFs for a population of CPn neurons (control internal, n = 11, left; 10 mm BAPTA internal, n = 16, right) in baseline conditions (blue) and after blockade of KV7 channels with XE991 (pink). C, comparisons of the magnitude (left) and duration (right) of cholinergic responses in baseline conditions and after addition of XE991 in control and BAPTA‐filled CPn neurons. Asterisks indicate significant differences (P < 0.05): white asterisks indicate significant changes from pre‐ACh firing frequencies, and black asterisks indicate significant differences between conditions.
Figure 9
Figure 9. Blockade of inward calcium conductances reduces persistence of cholinergic excitation
A and B, plots of mean ISFs over time in populations of neurons exposed to exogenous ACh in baseline (blue) or after manipulation of calcium conductances (dark green, addition of 200 μm cadmium, A; light green, transition to calcium‐free aSCF, B). C, comparisons of the peak increase in firing frequency (left) and response duration (right) in CPn neurons recorded with control (i.e. non‐BAPTA) intracellular solution, or with 10 mm intracellular BAPTA, before and after addition of cadmium (light green) or removal of external calcium (dark green). D, plots of mean ISFs for a population of CPn neurons in baseline conditions (blue) and after adding XE991 (10 μm) in low potassium (0.5 mm) aCSF (purple; n = 8). E, comparisons of the magnitude (left) and duration (right) of excitatory responses in baseline (BAPTA) conditions and in the presence of XE991 and 0.5 mm external potassium. Asterisks indicate significant differences (P < 0.05) between conditions.
Figure 10
Figure 10. Cholinergic excitation involves M‐current and a calcium conductance
A, voltage response of a CPn neuron to ACh (100 ms) in baseline conditions (10 mm BAPTA internal and XE991, dark blue trace), after addition of cadmium (200 μm, green trace) and during wash (light blue trace). Note presence of up–down states upon combination of BAPTA, XE991 and cadmium. B, plots of mean ISFs for a population of CPn neurons in baseline conditions and after transition to XE991 (10 μm) in calcium‐free aCSF (n = 11). C, comparisons of the magnitude (left) and duration (right) of excitatory responses in baseline (BAPTA) conditions (blue) and in the presence of XE991 and calcium‐free aCSF (n = 11). Asterisks indicate significant differences (P < 0.05) between conditions.
Figure 11
Figure 11. Model of cholinergic regulation of cortical projection neurons
A, diagram of cholinergic regulation of cortical projection neurons. ACh promotes cortical output to the brainstem by preferentially exciting corticopontine (CPn) neurons relative to commissural/callosal (COM) neurons. B, diagram of three ionic mechanisms contributing to Gq‐triggered excitation in CPn neurons: suppression of KV7 channels (M‐current), activation of the non‐specific cation conductance underlying the calcium‐dependent afterdepolarization (ADP), and activation of a calcium‐sensitive but calcium‐permeable non‐specific cation (NSC) conductance.

Comment in

References

    1. Allen TG, Abogadie FC & Brown DA (2006). Simultaneous release of glutamate and acetylcholine from single magnocellular “cholinergic” basal forebrain neurons. J Neurosci 26, 1588–1595. - PMC - PubMed
    1. Andrade R (1991). Cell excitation enhances muscarinic cholinergic responses in rat association cortex. Brain Res 548, 81–93. - PubMed
    1. Avesar D & Gulledge AT (2012). Selective serotonergic excitation of callosal projection neurons. Front Neural Circuits 6, 12. - PMC - PubMed
    1. Bentley P, Husain M & Dolan RJ (2004). Effects of cholinergic enhancement on visual stimulation, spatial attention, and spatial working memory. Neuron 41, 969–982. - PubMed
    1. Bockaert J, Perroy J, Becamel C, Marin P & Fagni L (2010). GPCR interacting proteins (GIPs) in the nervous system: Roles in physiology and pathologies. Annu Rev Pharmacol Toxicol 50, 89–109. - PubMed

Publication types

MeSH terms

LinkOut - more resources