Multicenter Study
. 2018 Feb;83(2):210-222.
doi: 10.1002/ana.25145. Epub 2018 Feb 6.

Deep gray matter volume loss drives disability worsening in multiple sclerosis

Affiliations
Multicenter Study

Deep gray matter volume loss drives disability worsening in multiple sclerosis

Arman Eshaghi et al. Ann Neurol. 2018 Feb.

Abstract

Objective: Gray matter (GM) atrophy occurs in all multiple sclerosis (MS) phenotypes. We investigated whether there is a spatiotemporal pattern of GM atrophy that is associated with faster disability accumulation in MS.

Methods: We analyzed 3,604 brain high-resolution T1-weighted magnetic resonance imaging scans from 1,417 participants: 1,214 MS patients (253 clinically isolated syndrome [CIS], 708 relapsing-remitting [RRMS], 128 secondary-progressive [SPMS], and 125 primary-progressive [PPMS]), over an average follow-up of 2.41 years (standard deviation [SD] = 1.97), and 203 healthy controls (HCs; average follow-up = 1.83 year; SD = 1.77), attending seven European centers. Disability was assessed with the Expanded Disability Status Scale (EDSS). We obtained volumes of the deep GM (DGM), temporal, frontal, parietal, occipital and cerebellar GM, brainstem, and cerebral white matter. Hierarchical mixed models assessed annual percentage rate of regional tissue loss and identified regional volumes associated with time-to-EDSS progression.

Results: SPMS showed the lowest baseline volumes of cortical GM and DGM. Of all baseline regional volumes, only that of the DGM predicted time-to-EDSS progression (hazard ratio = 0.73; 95% confidence interval, 0.65, 0.82; p < 0.001): for every standard deviation decrease in baseline DGM volume, the risk of presenting a shorter time to EDSS worsening during follow-up increased by 27%. Of all longitudinal measures, DGM showed the fastest annual rate of atrophy, which was faster in SPMS (-1.45%), PPMS (-1.66%), and RRMS (-1.34%) than CIS (-0.88%) and HCs (-0.94%; p < 0.01). The rate of temporal GM atrophy in SPMS (-1.21%) was significantly faster than RRMS (-0.76%), CIS (-0.75%), and HCs (-0.51%). Similarly, the rate of parietal GM atrophy in SPMS (-1.24-%) was faster than CIS (-0.63%) and HCs (-0.23%; all p values <0.05). Only the atrophy rate in DGM in patients was significantly associated with disability accumulation (beta = 0.04; p < 0.001).

Interpretation: This large, multicenter and longitudinal study shows that DGM volume loss drives disability accumulation in MS, and that temporal cortical GM shows accelerated atrophy in SPMS than RRMS. The difference in regional GM atrophy development between phenotypes needs to be taken into account when evaluating treatment effect of therapeutic interventions. Ann Neurol 2018;83:210-222.


Figures

Figure 1
Figure 1
Image analysis pipeline. An unbiased symmetric image registration approach was used to calculate atrophy. [Color figure can be viewed at www.annalsofneurology.org]
Figure 2
Figure 2
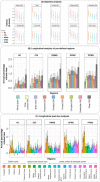
Baseline volumes and annual percentage loss of brain regions in clinical phenotypes and healthy controls. Adjusted baseline values for HCs, CIS, RRMS, SPMS, and PPMS are shown in (A), where the adjusted mean is shown as a point, and error bars show the 95% confidence interval. Adjusted p values of pair‐wise comparisons between groups are shown in Supplementary Table 4. Longitudinal analyses are shown in (B) and (C). Bar charts of the adjusted annual percentage of loss are shown in (B) for the predefined regions. Height of each bar chart is the average estimate of the percentage annual loss from the mixed‐effects model for each group. Error bars represent 95% confidence interval of these estimates. Adjusted p values for pair‐wise comparison between regions across clinical phenotypes and HCs are shown in Supplementary Table 4. White matter volumes are not shown in (B) and (C) because they did not show a significant change over time in any clinical phenotype. Post‐hoc analyses of annual percentage loss are shown in (C) where DGM nuclei, temporal, limbic, and default mode network regions were selected. Similar to (B), the adjusted average annual percentage volume loss for these regions is the height of each bar chart and error bars represent 95% confidence intervals. Baseline values (A) and rates (B and C) were adjusted in a single mixed‐effects hierarchical model including age, sex, total intracranial volume at baseline, scanner magnetic field, and their interactions with time as the fixed effects. Center, subject and visits were nested (hierarchical) random effects. HC = healthy controls; CIS = clinically isolated syndrome; RRMS = relapsing‐remitting multiple sclerosis; SPMS = secondary‐progressive multiple sclerosis; PPMS = primary‐progressive multiple sclerosis. [Color figure can be viewed at www.annalsofneurology.org]
Figure 3
Figure 3
DGM volume predicts future progression of EDSS. Survival curves for time to event (sustained EDSS progression; see Patients and Methods for definition) in CIS, relapse onset, and PPMS. We have analyzed CIS and relapse‐onset patients together because a proportion of patients convert from CIS to RRMS, or from RRMS to SPMS, during the course of study. Hazard ratios for models with continuous outcome variables (regional volumes) are reported. DGM = deep gray matter; EDSS = Expanded‐Disability Status Scale; HC, healthy controls; CIS, clinically isolated syndrome; RRMS, relapsing‐remitting multiple sclerosis; SPMS, secondary‐progressive multiple sclerosis; PPMS, primary‐progressive multiple sclerosis; HR = hazard ratio; CI = confidence interval. [Color figure can be viewed at www.annalsofneurology.org]
Figure 4
Figure 4
Risk of EDSS progression during follow‐up for each Z‐score volume loss of the brain regions at baseline (post‐hoc analysis). Results of the post‐hoc Cox proportional hazards univariate models are shown for the time‐to‐event analyses (event = sustained EDSS worsening; see Patients and Methods for the definition) in the regions of Neuromorphometrics' atlas, which are shown in (A). The predictors were the baseline volumes of the regions shown in the x‐axes of (B) for CIS, RRMS, and SPMS and (C) for PPMS. CIS, RRMS, and SPMS were analyzed together because several patients convert from one phenotype to another. Brain maps are shown in the left column, and bar charts of the same analyses are shown in the right column of (B) and (C). Only regions whose p value of the survival analysis survived FDR correction (adjusted p < 0.05) are shown in (B) and (C). The y‐axes show the risk of progression for each Z‐score loss in the volume of the corresponding brain region on x‐axes. For example, for every Z‐score loss of the thalamus volume at baseline, the risk of EDSS worsening during follow‐up increased by 37% for the CIS, RRMS, and SPMS group and 40% for PPMS. Color maps code the importance of baseline volumes of the regions to predict EDSS worsening (or EDSS progression) during follow‐up. The absolute values of coefficients for ventricular volumes are shown in (B), because they have an effect in the opposite direction of other structures. Error bars indicate the 95% confidence intervals. EDSS = Expanded‐Disability Status Scale; HC, healthy controls; CIS, clinically isolated syndrome; RRMS, relapsing‐remitting multiple sclerosis; SPMS, secondary‐progressive multiple sclerosis; PPMS, primary‐progressive multiple sclerosis. [Color figure can be viewed at www.annalsofneurology.org]

References

    1. Browne P, Chandraratna D, Angood C, et al. Atlas of Multiple Sclerosis 2013: a growing global problem with widespread inequity. Neurology 2014;83:1022–1024. - PMC - PubMed
    1. Mahad DH, Trapp BD, Lassmann H. Pathological mechanisms in progressive multiple sclerosis. Lancet Neurol 2015;14:183–193. - PubMed
    1. Geurts JJG, Calabrese M, Fisher E, Rudick RA. Measurement and clinical effect of grey matter pathology in multiple sclerosis. Lancet Neurol 2012;11:1082–1092. - PubMed
    1. Bermel RA, Bakshi R. The measurement and clinical relevance of brain atrophy in multiple sclerosis. Lancet Neurol 2006;5:158–170. - PubMed
    1. De Stefano N, Giorgio A, Battaglini M, et al. Assessing brain atrophy rates in a large population of untreated multiple sclerosis subtypes. Neurology 2010;74:1868–1876. - PubMed

Publication types