Review
. 2019 Jan:118:69-76.
doi: 10.1016/j.bone.2018.01.009. Epub 2018 Jan 10.

Marrow adipose tissue imaging in humans

Affiliations
Review

Marrow adipose tissue imaging in humans

Vibha Singhal et al. Bone. 2019 Jan.

Abstract

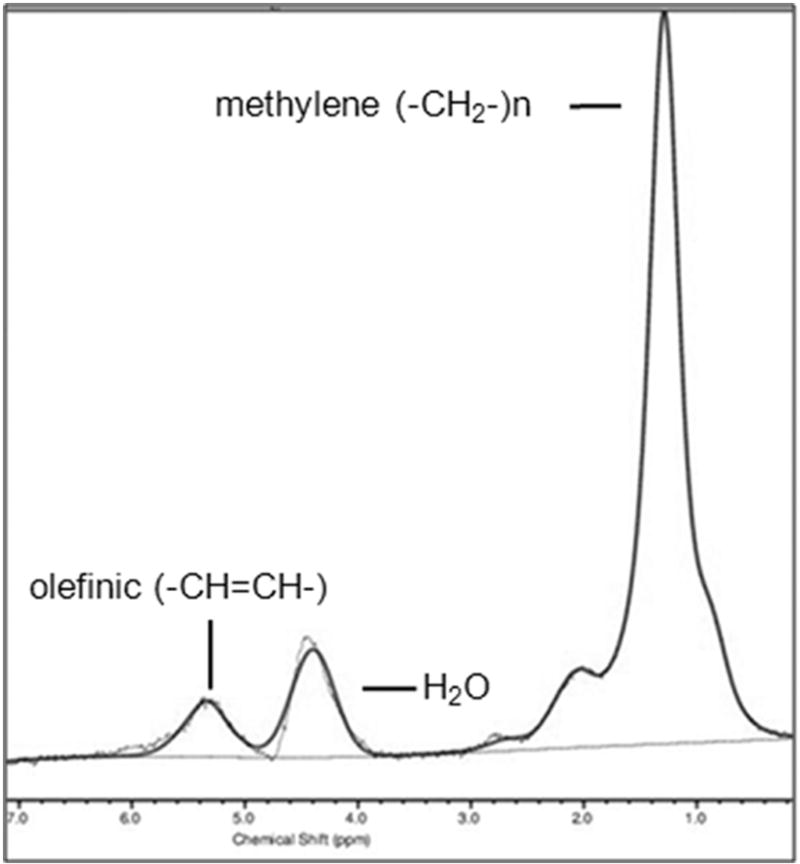
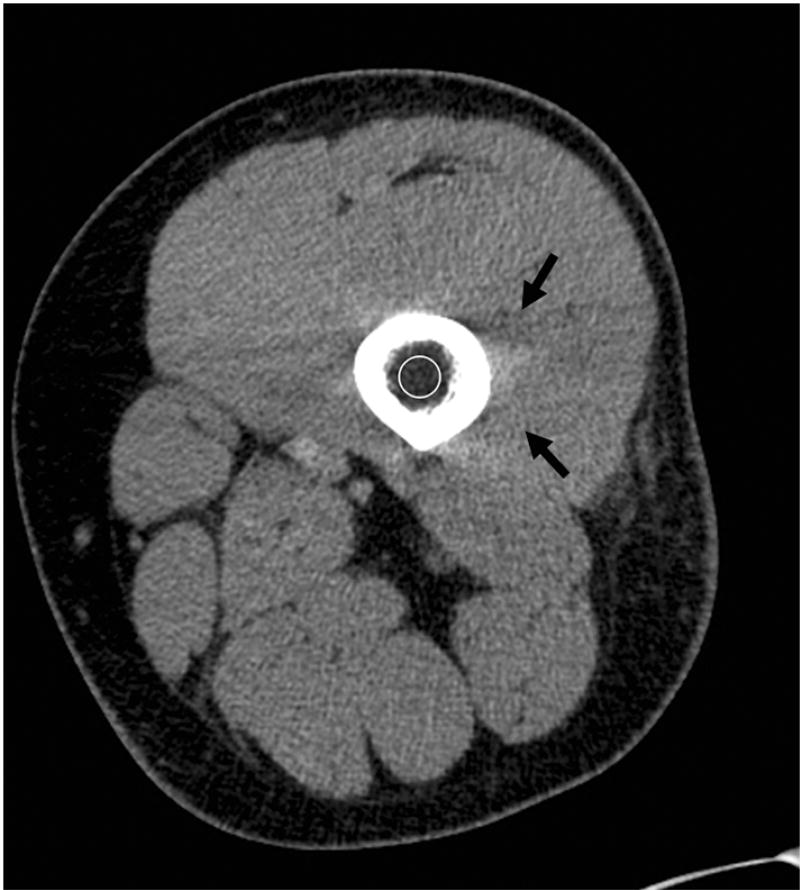
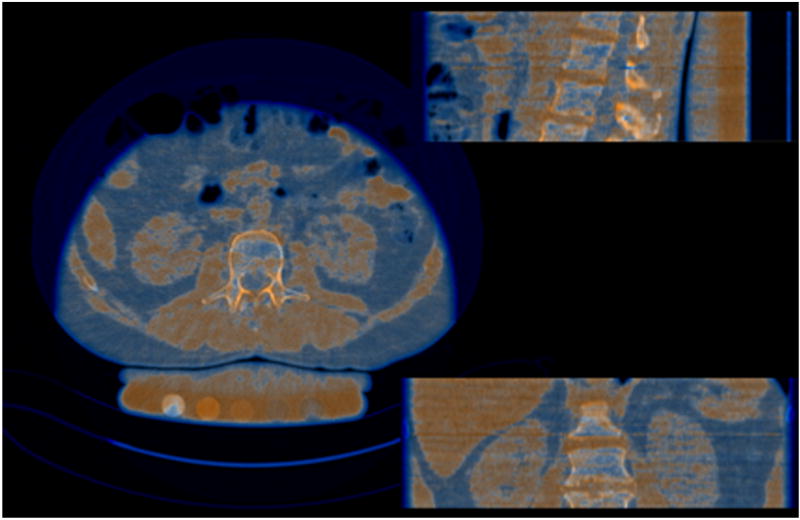
Bone strength is affected not only by bone mineral density (BMD) and bone microarchitecture but also its microenvironment. Recent studies have focused on the role of marrow adipose tissue (MAT) in the pathogenesis of bone loss. Osteoblasts and adipocytes arise from a common mesenchymal stem cell within bone marrow and many osteoporotic states, including aging, medication use, immobility, over - and undernutrition are associated with increased marrow adiposity. Advancements in imaging technology allow the non-invasive quantification of MAT. This article will review magnetic resonance imaging (MRI)- and computed tomography (CT)-based imaging technologies to assess the amount and composition of MAT. The techniques that will be discussed are anatomic T1-weighted MRI, water-fat imaging, proton MR spectroscopy, single energy CT and dual energy CT. Clinical applications of MRI and CT techniques to determine the role of MAT in patients with obesity, anorexia nervosa, and type 2 diabetes will be reviewed.

Keywords: Dual energy computed tomography (DECT); Magnetic resonance imaging; Marrow adipose tissue (MAT); Marrow adipose tissue composition; Proton MR spectroscopy.


Conflict of interest statement

Disclosures: The authors do not have any conflicts of interests to disclose.

Figures

Figure 1
Figure 1
Coronal T1-weighted (A) and coronal fat-suppressed T2-weighted (B) MR images of the knee demonstrate normal marrow adipose tissue which is hyperintense (bright) on T1- and hypointense (dark) on fat-suppressed T2-weighted images. Small islands of red marrow are of intermediate signal intensity (arrows).
Figure 2
Figure 2
T1-weighted MR images of the pelvis showing normal physiologic conversion of red (hematopoietic) to yellow (fatty) marrow. At birth (A) marrow is red and diffusely hypointense (dark) (diamonds) compared to subcutaneous fat. During adolescences (B), physiologic conversion from red to fatty marrow occurs, involving first the epiphyses and epiphysis equivalents, such as the greater trochanters, and diaphyses (black diamonds) while the metaphyses still contain red marrow (white diamond). In adulthood (C), there is nearly complete conversion to fatty marrow with only few remaining islands of red marrow (curved arrows).
Figure 3
Figure 3
Coronal T1-weighted MR image of the knee in a subject with obesity demonstrates marrow reconversion with prominent red marrow in the distal femoral and proximal tibial meta-diaphyses (arrowheads).
Figure 4
Figure 4
Serous atrophy of bone marrow in a patient with cancer cachexia. Coronal T1-weighted MR image of the pelvis (A) demonstrates hypointense (dark) marrow and subcutaneous fat (see Figure 2C for the normal appearance of marrow on T1-weighted images). Fat suppressed T2-weighted MR image of the pelvis (B) demonstrates abnormal hyperintense (bright) marrow and fat (see Figure 1B for the normal appearance of marrow on fat-suppressed T2-weighted images). Note the lack of subcutaneous fat in this patient with cachexia.
Figure 5
Figure 5
Post radiation changes of the lumbar spine. Sagittal T1-weighted MR image after radiation therapy demonstrates increased MAT content of the lumbar spine (black arrowheads) caudal to the radiation port (white arrow). Normal hematopoietic marrow is seen cranial to the radiation port (white arrowheads).
Figure 6
Figure 6
Sagittal fat fraction map reconstructed from water and fat images of the lumbar spine. The fat fraction can be assessed by drawing a region of interest (square in the L2 vertebral body). Fat fraction of L2 was 27%. The color scale on the right side of the image is percent fat ×10−1.
Figure 7
Figure 7
Coronal fat fraction map reconstructed from water and fat images of the pelvis showing fat content of different portions of the femur which can be assessed in a single examination by drawing different regions of interest (squares). The fat fraction of the epiphysis [E] was 68%, of the metaphysis [M] 41% and the subtrochanteric femoral diaphysis [D] was 48%. The color scale on the right side of the image is percent fat ×10−1.
Figure 8
Figure 8
Quantification of marrow adipose tissue (MAT) by proton MR spectroscopy (1HMRS). 1H-MRS of the 2nd lumbar vertebra (A), proximal femoral metaphysis (B) and femoral diaphysis (C) in a premenopausal woman demonstrating increasing MAT content from the lumbar spine to the femoral diaphysis.
Figure 9
Figure 9
Composition of marrow adipose tissue (MAT). Proton MR spectroscopy (1H-MRS) of the 2nd lumbar vertebra obtained with water suppression demonstrates combined olefinic protons at 5.2 and 5.3 ppm (-CH=CH-, an estimate of fatty acid unsaturated bonds) and methylene protons at 1.3 ppm [(-CH2-)n, an estimate of fatty acids saturated bonds]. Residual water (H2O) is noted at 4.7 ppm.
Figure 10
Figure 10
Single energy axial CT of the thigh showing low attenuation (circle) of the femoral marrow cavity, measuring −47 Hounsfield Units. Beam hardening artifact, as indicated by dark streaks, from the dense cortical bone is present (black arrows).
Figure 11
Figure 11
Overlay images from dual energy CT of L2. Orange indicates red marrow and blue indicates fatty marrow.

References

    1. Osteoporosis prevention, diagnosis, and therapy. NIH Consens Statement. 2000;17(1):1–45. - PubMed
    1. Gimble JM, et al. Playing with bone and fat. J Cell Biochem. 2006;98(2):251–66. - PubMed
    1. Pino AM, et al. Qualitative Aspects of Bone Marrow Adiposity in Osteoporosis. Front Endocrinol (Lausanne) 2016;7:139. - PMC - PubMed
    1. Rendina-Ruedy E, Rosen CJ. Bone-Fat Interaction. Endocrinol Metab Clin North Am. 2017;46(1):41–50. - PMC - PubMed
    1. Devlin MJ, Rosen CJ. The bone-fat interface: basic and clinical implications of marrow adiposity. Lancet Diabetes Endocrinol. 2015;3(2):141–7. - PMC - PubMed

Publication types