Review
. 2018 Apr;34(4):301-312.
doi: 10.1016/j.tig.2017.12.005. Epub 2018 Jan 10.

Supervised Machine Learning for Population Genetics: A New Paradigm

Affiliations
Review

Supervised Machine Learning for Population Genetics: A New Paradigm

Daniel R Schrider et al. Trends Genet. 2018 Apr.

Abstract

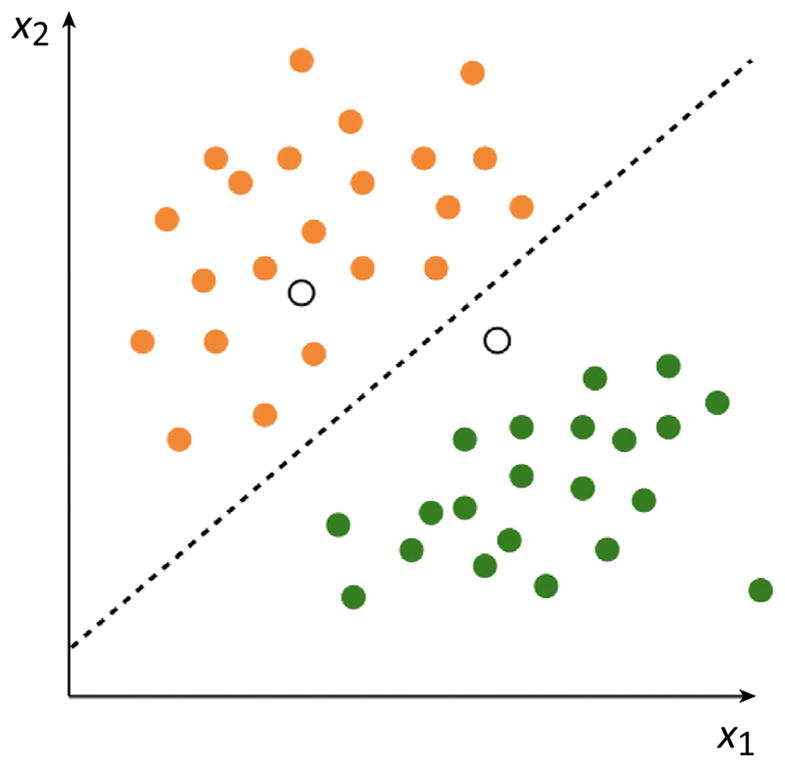
As population genomic datasets grow in size, researchers are faced with the daunting task of making sense of a flood of information. To keep pace with this explosion of data, computational methodologies for population genetic inference are rapidly being developed to best utilize genomic sequence data. In this review we discuss a new paradigm that has emerged in computational population genomics: that of supervised machine learning (ML). We review the fundamentals of ML, discuss recent applications of supervised ML to population genetics that outperform competing methods, and describe promising future directions in this area. Ultimately, we argue that supervised ML is an important and underutilized tool that has considerable potential for the world of evolutionary genomics.


Figures

Figure I
Figure I. An Imaginary Training Set of Two Types of Fruit, Oranges (Orange Filled Points) and Apples (Green Filled Points), Where Two Measurements Were Made for Each Fruit
With a training set in hand we can use supervised ML to learn a function that can differentiate between classes (broken line) such that the unknown class of new datapoints (unlabeled points above) can be predicted.
Figure II
Figure II. An Example Application of Supervised ML to Demographic Model Selection
In this example population samples experiencing constant population size (equilibrium), a recent instantaneous population decline (contraction), or recent instantaneous expansion (growth) were simulated. A variant of a random forest classifier [51] was trained, which is an ensemble of semi-randomly generated decision trees, to discriminate between these three models on the basis of a feature vector consisting of two population genetic summary statistics [34,74]. (A) The decision surface: red points represent the growth scenario, dark-blue points represent equilibrium, and light-blue points represent contraction. The shaded areas in the background show how additional datapoints would be classified – note the non-linear decision surface separating these three classes. (B) The confusion matrix obtained from measuring classification accuracy on an independent test set. Data were simulated using ms [75], and classification was performed via scikitlearn [76]. All code used to create these figures can be found in a collection of Jupyter notebooks that demonstrate some simple examples of using supervised ML for population genetic inference provided here: https://github.com/kern-lab/popGenMachineLearningExamples.
Figure III
Figure III. A Visualization of S/HIC Feature Vector and Classes
The S/HIC feature vector consists of π [77], θw^ [74], θH^ [34], the number (#) of distinct haplotypes, average haplotype homozygosity, H12 and H2/H1 [78,79], ZnS [37], and the maximum value of ω [48]. The expected values of these statistics are shown for genomic regions containing hard and soft sweeps (as estimated from simulated data). Fay and Wu’s H [34] and Tajima’s D [39] are also shown, though these may be omitted from the vector because they are redundant with π, θw^, and θH^. To classify a given region the spatial patterns of these statistics are examined across a genomic window to infer whether the center of the window contains a hard selective sweep (blue shaded area on the left, using statistics calculated within the larger blue window), is linked to a hard sweep (purple shaded area and larger window, left), contains a soft sweep (red, on the right), is linked to soft sweep (orange, right), or is evolving neutrally (not shown).

Similar articles

Cited by

References

    1. Breiman L. Statistical modeling: the two cultures (with comments and a rejoinder by the author) Stat Sci. 2001;16:199–231.
    1. Elyashiv E, et al. A genomic map of the effects of linked selection in Drosophila. PLoS Genet. 2016;12:e1006130. - PMC - PubMed
    1. Hinton G, et al. Deep neural networks for acoustic modeling in speech recognition: The shared views of four research groups. IEEE Signal Process Mag. 2012;29:82–97.
    1. Sebastiani F. Machine learning in automated text categorization. ACM Comput Surv. 2002;34:1–47.
    1. Krizhevsky A, et al. Imagenet classification with deep convolutional neural networks. In: Fereira F, editor. Advances in Neural Information Processing Systems 25. Neural Information Processing Systems Foundation; 2012. pp. 1097–1105.

Publication types