. 2018 Mar:159:215-228.
doi: 10.1016/j.biomaterials.2018.01.014. Epub 2018 Jan 9.

Simultaneous inhibition of hedgehog signaling and tumor proliferation remodels stroma and enhances pancreatic cancer therapy

Affiliations

Simultaneous inhibition of hedgehog signaling and tumor proliferation remodels stroma and enhances pancreatic cancer therapy

Jun Zhao et al. Biomaterials. 2018 Mar.

Abstract

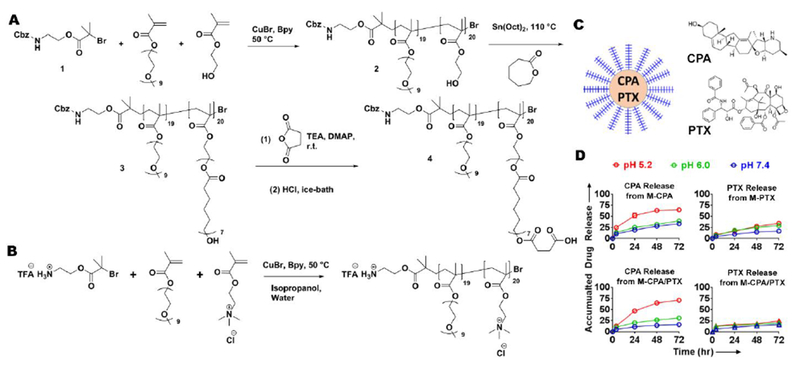
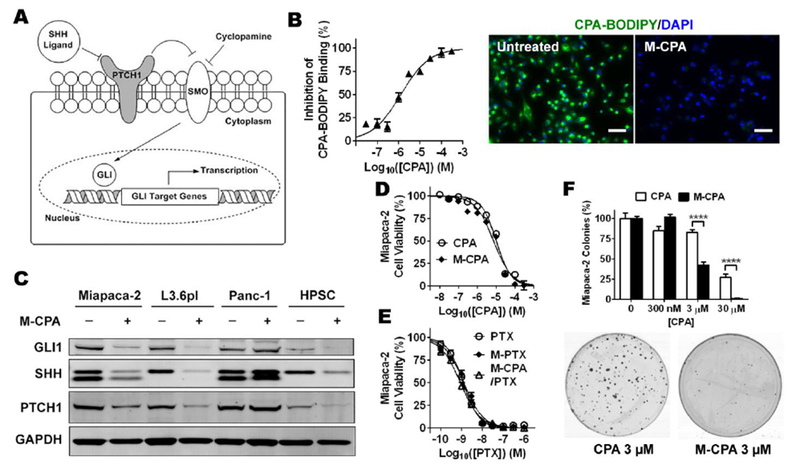
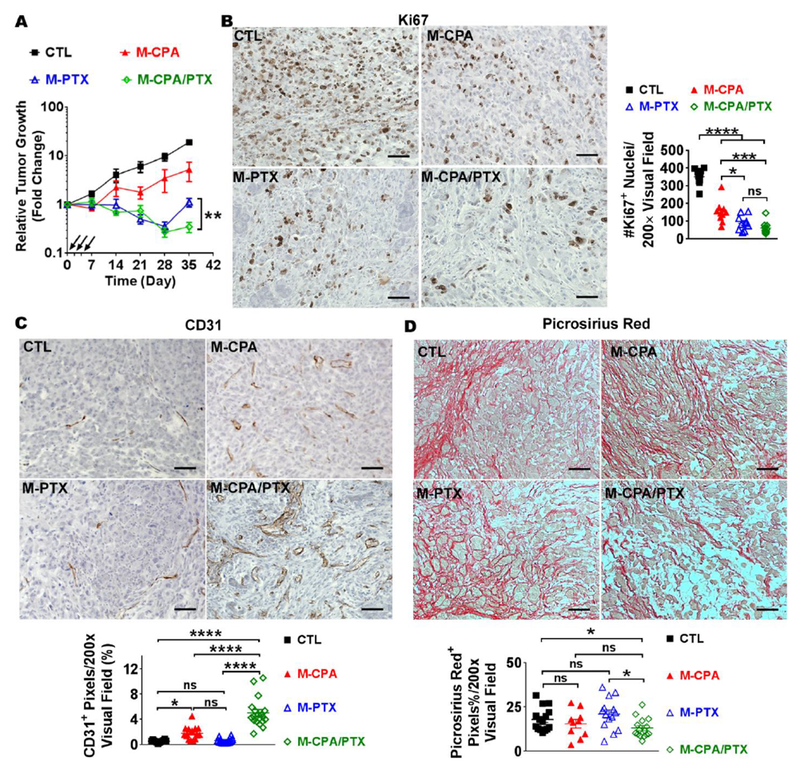
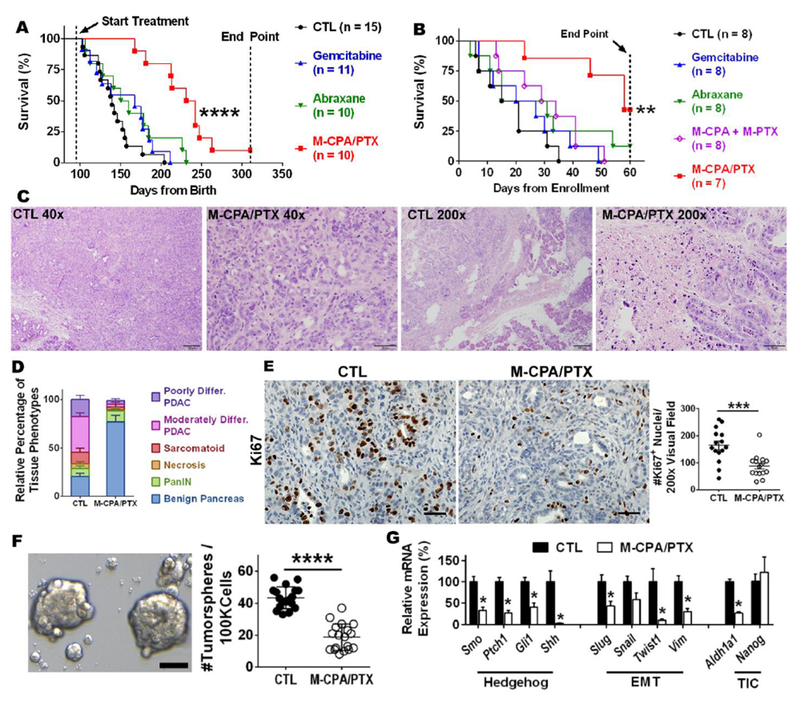
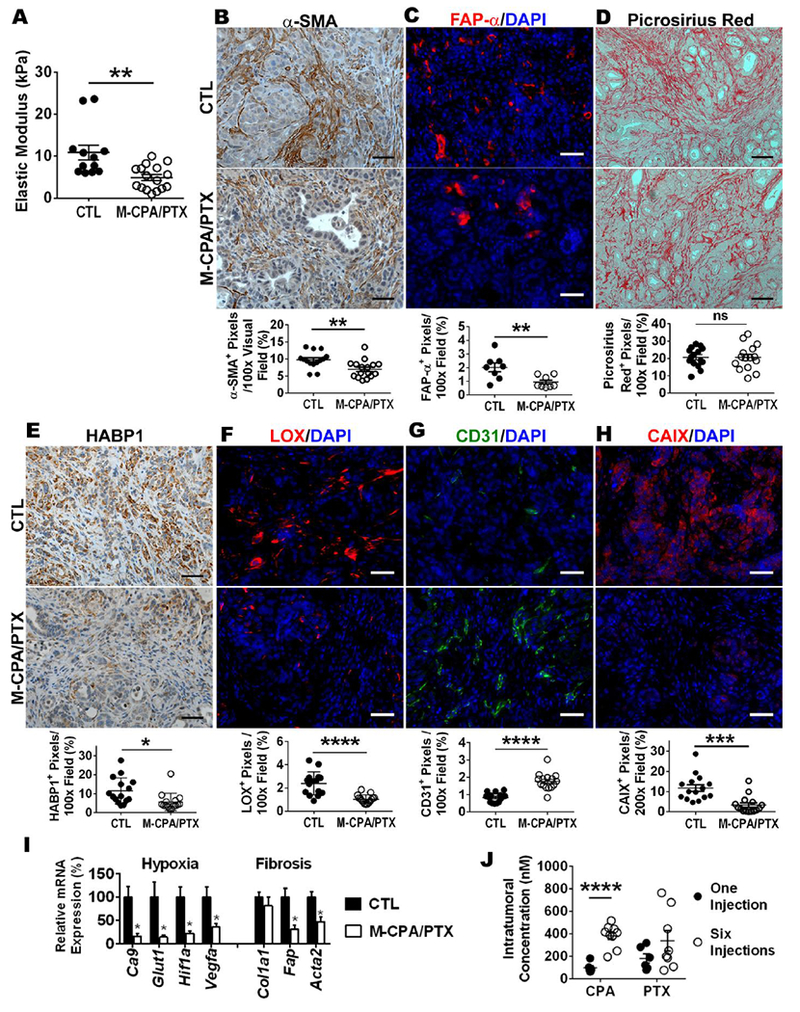
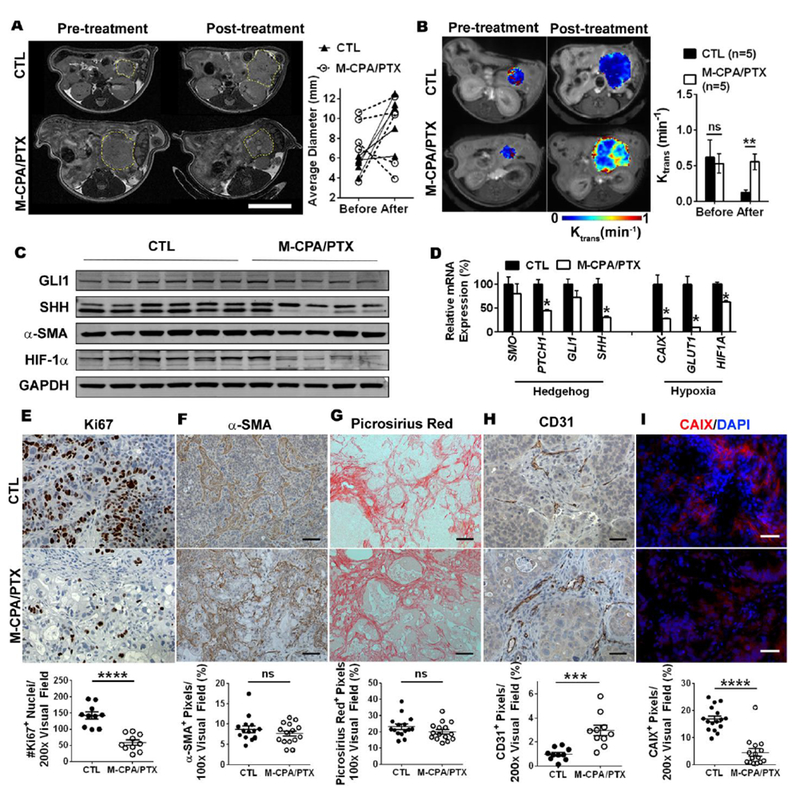
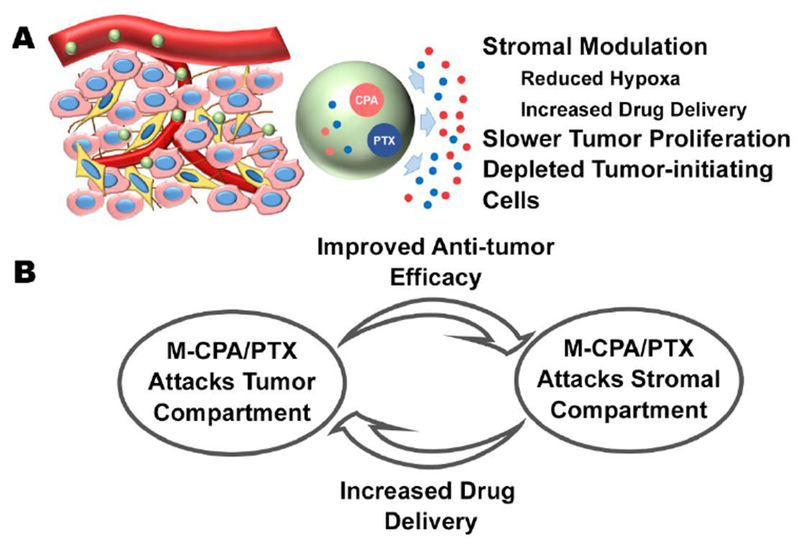
Pancreatic ductal adenocarcinoma (PDAC) is one of the deadliest cancers. It has an excessive desmoplastic stroma that can limit the intratumoral delivery of chemotherapy drugs, and protect tumor cells against radiotherapy. Therefore, both stromal and tumor compartments need to be addressed in order to effectively treat PDAC. We hereby co-deliver a sonic hedgehog inhibitor, cyclopamine (CPA), and a cytotoxic chemotherapy drug paclitaxel (PTX) with a polymeric micelle formulation (M-CPA/PTX). CPA can deplete the stroma-producing cancer-associated fibroblasts (CAFs), while PTX can inhibit tumor proliferation. Here we show that in clinically relevant PDAC models, M-CPA effectively modulates stroma by increasing microvessel density, alleviating hypoxia, reducing matrix stiffness while maintaining the tumor-restraining function of extracellular matrix. M-CPA/PTX also significantly extends animal survival by suppressing tumor growth and lowering the percentages of poorly to moderately differentiated tumor phenotypes. Our study suggests that using multifunctional nanoparticles to simultaneously target stromal and tumor compartments is a promising strategy for PDAC therapy.

Keywords: Cancer-associated fibroblast; Pancreatic cancer; Polymeric micelles; Sonic hedgehog signaling; Stromal modulation.


Figures

Figure 1.
Figure 1.. Formulation and characterization of CPA- and/or PTX-loaded polymeric micelles.
(A) Synthesis route of anionic block copolymer. (B) Synthesis route of cationic block copolymer. (C) Schematic illustration of polymeric micelles. (D) Drug release profiles at 37°C under pH 5.2, 6.0, and 7.4. N = 3 in each group.
Figure 2.
Figure 2.. Evaluation of drug-loaded polymeric micelles in human pancreatic cancer cell lines.
(A) Schemes of canonical SHH signaling pathway. (B) M-CPA inhibited binding of CPA-BODIPY to SMO receptors on MiaPaca-2 cells after 24-h incubation. Left: percentage inhibition as a function of equivalent CPA concentration curve. Right: representative photomicrography showing binding of CPA-BODIPY to cancer cells in the absence and presence of M-CPA. Scale bars = 50 µm. (C) Western blots of representative SHH pathway proteins in MiaPaca-2, L3.6pl, and Panc-1 pancreatic cancer cells and immortalized HPSCs after 48 h of incubation with and without 10 µM M-CPA. (D) MiaPaca-2 cell viability after 72-h incubation with free CPA (dissolved in DMSO) or M-CPA measured by MTS assay. N = 6 for each data point. (E) MiaPaca-2 cell viability after 72-h incubation with free PTX (dissolved in DMSO), M-PTX, or M-CPA/PTX measured by MTS assay. N = 6 for each data point. (F) Normalized number of MiaPaca-2 colonies formed after 10-day incubation with CPA or M-CPA, with representative photographs of colonies. N = 3 for each group.
Figure 3.
Figure 3.. M-CPA/PTX had better antitumor efficacy than M-CPA or M-PTX in an orthotopic human PDAC xenograft model.
(A) Relative tumor growth curves of M-CPA, M-PTX, or M-CPA/PTX-treated tumors in MiaPaca-2-luciferase orthotopic xenograft mouse model. Tumor growth was monitored by bioluminescence imaging. Injections are marked by black arrows. Untreated mice were used as control (CTL). **p < 0.01, N = 10 in each group. (B-D) Representative micrographs of Ki67 (B), CD31 (C), and Picrosirius red (D) IHC staining and corresponding quantifications. N = 10 in each group. Scale bars = 50 µm. Data are presented as mean ± SEM. Significance was determined using 1-way ANOVA followed by Tukey post hoc analysis. *p < 0.05, **p < 0.01, ***p < 0.001, ****p < 0.0001, ns = not significant.
Figure 4.
Figure 4.. M-CPA/PTX prolonged survival of KPC-Luc mice and alleviated hypoxia.
(A) Kaplan-Meier survival analysis for KPC-Luc mice with early treatment. ****p < 0.0001, log-rank test. (B) Kaplan-Meier survival analysis for KPC-Luc mice with treatment started when tumors became palpable. ***p = 0.0033, log-rank test. (C) Representative H&E-stained sections of late-stage tumors after 2 weeks of treatment with M-CPA/PTX. Untreated tumors were used as control (CTL). Scale bars = 200 µm for 40× images and 50 µm for 200x images. (D) Distribution of histological phenotypes of late-stage tumors after 2 weeks of treatment with M-CPA/PTX (N = 10). Untreated tumors were used as CTL (N = 8). The M-CPA/PTX-treated tumor group had a significantly lower proportion of poorly differentiated PDAC (p < 0.05) or moderately differentiated PDAC (p < 0.0001) and a significantly higher proportion of benign pancreas (p < 0.0001). Significance of differences was determined using 2-way ANOVA followed by Sidak’s multiple comparison test. differ. = differentiated. (E) Representative micrographs of Ki67 IHC staining and corresponding quantifications. N = 15 in each group. Scale bars = 50 µm. (F) Representative micrographs of tumor spheres and corresponding quantifications. N = 18 for each group. Arrows indicate eligible tumor spheres (>50 µm). Scale bars = 50 µm. (G) Expression levels of mRNA for selected genes from CTL and M-CPA/PTX-treated tumors. Results are mean ± SEM of 4 mice in each group. RT-PCR was performed in technical duplicates, and values were normalized to 18S. Significance of differences between CTL and M-CPA/PTX groups was determined using Student’s unpaired t test. *p < 0.05, **p < 0.01, ***p < 0.001, ****p < 0.0001, ns = not significant.
Figure 5.
Figure 5.. M-CPA/PTX modulated stromal components in KPC-Luc tumor.
(A) Quantification of the elastic modulus of tumors. Results are representative of 3 mice in each group. Five randomly selected locations were measured on each tumor. (B) Representative micrographs of α-SMA IHC staining and corresponding quantifications. N = 15 in each group. Scale bars = 50 µm. (C) Representative micrographs of FAP-α (red) and DAPI (blue) dual-immunofluorescence staining and corresponding quantifications. N = 8 in each group. Scale bars = 50 µm. (D) Representative micrographs of Picrosirius red IHC staining and corresponding quantifications. N = 15 in each group. Scale bars = 100 µm. (E) Representative micrographs of HABP1 IHC staining and corresponding quantifications. N = 15 in each group. Scale bars = 50 µm. (F Representative micrographs of LOX (red) and DAPI (blue) dual-immunofluorescence staining and corresponding quantifications. N = 15 in each group. Scale bars = 50 µm. (G) Representative micrographs of CD31 IHC staining and corresponding quantifications. N = 15 in each group. Scale bars = 50 µm. (H) Representative micrographs of CAIX (red) and DAPI (blue) dual-immunofluorescence staining and corresponding quantifications. N = 15 in each group. Scale bars = 50 µm. (I) Relative mRNA expression for selected genes from CTL and M-CPA/PTX-treated tumors. Results are representative of 4 mice in each group. RT-PCR was performed in technical duplicates, and values were normalized to 18S. (J) Intratumoral drug concentrations of late-stage tumor at 24 h after 1 or 6 intravenous injections of M-CPA/PTX. The dose for each injection was 5 mg/kg/drug. Six injections were completed over 2 weeks. The CPA concentration was significantly higher after 6 injections than after 1 injection (p < 0.0001). N = 6 for 1-injection group; N = 9 for 6-injection group.
Figure 6:
Figure 6:. M-CPA/PTX was effective against orthotopic PDX models.
(A) Representative T2-weighted axial magnetic resonance images and individual sizes of CTL and M-CPA/PTX-treated tumors at the start and end of the study. Tumor margin is outlined by yellow circle. Scale bars = 10 mm. (B) Representative T1-dyanmic contrast enhanced MRI of size-matched CTL and M-CPA/PTX-treated tumors, and corresponding quantification of Ktrans values. (C) Western blot images of selected SHH and hypoxia proteins. Tumor lysates were prepared from 6 CTL mice and 5 M-CPA/PTX-treated mice. (D) Relative mRNA expression of selected genes from CTL and M-CPA/PTX-treated tumors. Results are mean ± SEM of 4 mice in each group. RT-PCR was performed in technical duplicates, and values were normalized to HPRT1. (E) Representative Ki67 staining and corresponding quantification in PDX models (N = 15 in each group). (F&G) Representative micrographs of α-SMA IHC staining (F) and Picrosirius red–stained collagen IHC staining (G) and corresponding quantifications. N = 15 in each group. Scale bars = 100 µm. (H) Representative micrographs of CD31 and corresponding quantifications. N = 10 in each group. Scale bars = 50 µm. (I) Representative micrographs of CAIX (red)/DAPI (blue) dual-immunofluorescence staining and corresponding quantifications. N = 15 in each group. Scale bar = 50 µm. Data are presented as mean ± SEM. Significance of differences between CTL and M-CPA/PTX groups was determined using Student’s unpaired t test. ***p < 0.001, ****p < 0.0001, ns = not significant.
Figure 7.
Figure 7.. Proposed model of mechanisms of action for M-CPA/PTX.
(A) CPA and PTX released from M-CPA/PTX act on different compartments of PDAC. While PTX enriches TICs, CPA nullifies such an effect. Furthermore, CPA and PTX work together to disrupt tumor cell–CAFs communication, resulting in remodeling instead of depletion of PDAC stroma. (B) Multiple injections of M-CPA/PTX generate a positive feedback loop to enhance its efficacy. M-CPA/PTX modulates the stromal compartment to increase the drug delivery from ensuing injections. More efficient drug delivery increases the intratumoral concentration of drugs and thereby improves the antitumor efficacy.

Similar articles

Cited by

References

    1. Tempero MA, Berlin J, Ducreux M, Haller D, Harper P, Khayat D, Schmoll HJ, Sobrero A, Van Cutsem E, Pancreatic cancer treatment and research: an international expert panel discussion, Ann. Oncol. 22(7) (2011) 1500–6. - PubMed
    1. Feig C, Gopinathan A, Neesse A, Chan DS, Cook N, Tuveson DA, The pancreas cancer microenvironment, Clin. Cancer Res. 18(16) (2012) 4266–76. - PMC - PubMed
    1. Rucki AA, Zheng L, Pancreatic cancer stroma: understanding biology leads to new therapeutic strategies, World J. Gastroenterol. 20(9) (2014) 2237–46. - PMC - PubMed
    1. Kalluri R, The biology and function of fibroblasts in cancer, Nat. Rev. Cancer 16(9) (2016) 582–98. - PubMed
    1. Onishi H, Katano M, Hedgehog signaling pathway as a new therapeutic target in pancreatic cancer, World J. Gastroenterol. 20(9) (2014) 2335–42. - PMC - PubMed

Publication types