Proteome-Wide Characterization of Phosphorylation-Induced Conformational Changes in Breast Cancer
- PMID: 29332387
- PMCID: PMC5967234
- DOI: 10.1021/acs.jproteome.7b00795
Proteome-Wide Characterization of Phosphorylation-Induced Conformational Changes in Breast Cancer
Abstract
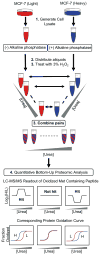
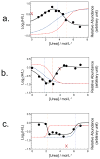
Because of the close link between protein function and protein folding stability, knowledge about phosphorylation-induced protein folding stability changes can lead to a better understanding of the functional effects of protein phosphorylation. Here, the stability of proteins from rates of oxidation (SPROX) and limited proteolysis (LiP) techniques are used to compare the conformational properties of proteins in two MCF-7 cell lysates including one that was and one that was not dephosphorylated with alkaline phosphatase. A total of 168 and 251 protein hits were identified with dephosphorylation-induced stability changes using the SPROX and LiP techniques, respectively. Many protein hits are previously known to be differentially phosphorylated or differentially stabilized in different human breast cancer subtypes, suggesting that the phosphorylation-induced stability changes detected in this work are disease related. The SPROX hits were enriched in proteins with aminoacyl-tRNA ligase activity. These enriched protein hits included many aminoacyl-tRNA synthetases (aaRSs), which are known from previous studies to have their catalytic activity modulated by phosphorylation. The SPROX results revealed that the magnitudes of the destabilizing effects of dephoshporylation on the different aaRSs were directly correlated with their previously reported aminoacylation activity change upon dephosphorylation. This substantiates the close link between protein folding and function.
Keywords: MCF-7; SILAC; SPROX; aminoacyl-tRNA synthase; chemical denaturation; limited proteolysis; post-translational modification; protein folding; proteomics.
Figures


Similar articles
-
Proteome-Wide Structural Biology: An Emerging Field for the Structural Analysis of Proteins on the Proteomic Scale.J Proteome Res. 2018 Nov 2;17(11):3614-3627. doi: 10.1021/acs.jproteome.8b00341. Epub 2018 Oct 8. J Proteome Res. 2018. PMID: 30222357 Free PMC article. Review.
-
Large-Scale Analysis of Breast Cancer-Related Conformational Changes in Proteins Using SILAC-SPROX.J Proteome Res. 2017 Sep 1;16(9):3277-3286. doi: 10.1021/acs.jproteome.7b00283. Epub 2017 Jul 27. J Proteome Res. 2017. PMID: 28673085 Free PMC article.
-
Global analysis of protein folding thermodynamics for disease state characterization.J Proteome Res. 2015 May 1;14(5):2287-97. doi: 10.1021/acs.jproteome.5b00057. Epub 2015 Apr 9. J Proteome Res. 2015. PMID: 25825992 Free PMC article.
-
Discovery of Tamoxifen and N-Desmethyl Tamoxifen Protein Targets in MCF-7 Cells Using Large-Scale Protein Folding and Stability Measurements.J Proteome Res. 2017 Nov 3;16(11):4073-4085. doi: 10.1021/acs.jproteome.7b00442. Epub 2017 Oct 11. J Proteome Res. 2017. PMID: 28927269 Free PMC article.
-
Experimental approaches for investigation of aminoacyl tRNA synthetase phosphorylation.Methods. 2017 Jan 15;113:72-82. doi: 10.1016/j.ymeth.2016.10.004. Epub 2016 Oct 8. Methods. 2017. PMID: 27729295 Free PMC article. Review.
Cited by
-
Direct visualization and profiling of protein misfolding and aggregation in live cells.Curr Opin Chem Biol. 2021 Oct;64:116-123. doi: 10.1016/j.cbpa.2021.05.008. Epub 2021 Jul 8. Curr Opin Chem Biol. 2021. PMID: 34246835 Free PMC article. Review.
-
Toward the analysis of functional proteoforms using mass spectrometry-based stability proteomics.Front Anal Sci. 2023;3:1186623. doi: 10.3389/frans.2023.1186623. Epub 2023 Jun 21. Front Anal Sci. 2023. PMID: 39072225 Free PMC article.
-
Comparative Analysis of Protein Folding Stability-Based Profiling Methods for Characterization of Biological Phenotypes.J Am Soc Mass Spectrom. 2023 Mar 1;34(3):383-393. doi: 10.1021/jasms.2c00248. Epub 2023 Feb 20. J Am Soc Mass Spectrom. 2023. PMID: 36802530 Free PMC article.
-
Proteome-Wide Structural Biology: An Emerging Field for the Structural Analysis of Proteins on the Proteomic Scale.J Proteome Res. 2018 Nov 2;17(11):3614-3627. doi: 10.1021/acs.jproteome.8b00341. Epub 2018 Oct 8. J Proteome Res. 2018. PMID: 30222357 Free PMC article. Review.
-
Chemo-Selection Strategy for Limited Proteolysis Experiments on the Proteomic Scale.Anal Chem. 2018 Dec 4;90(23):14039-14047. doi: 10.1021/acs.analchem.8b04122. Epub 2018 Nov 20. Anal Chem. 2018. PMID: 30403842 Free PMC article.
References
-
- Cohen P. The origins of protein phosphorylation. Nat Cell Biol. 2002;4(5):E127–30. - PubMed
-
- Humphrey SJ, James DE, Mann M. Protein Phosphorylation: A Major Switch Mechanism for Metabolic Regulation. Trends Endocrinol Metab. 2015;26(12):676–87. - PubMed
-
- Johnson LN. The regulation of protein phosphorylation. Biochem Soc Trans. 2009;37(Pt 4):627–41. - PubMed
-
- Witze ES, Old WM, Resing KA, Ahn NG. Mapping protein post-translational modifications with mass spectrometry. Nat Methods. 2007;4(10):798–806. - PubMed
Publication types
MeSH terms
Substances
Grants and funding
LinkOut - more resources
Full Text Sources
Other Literature Sources
Medical
Molecular Biology Databases

