

On the Functional Form of Temporal Discounting: An Optimized Adaptive Test
- PMID: 29332995
- PMCID: PMC5764197
- DOI: 10.1007/s11166-016-9242-y
On the Functional Form of Temporal Discounting: An Optimized Adaptive Test
Abstract
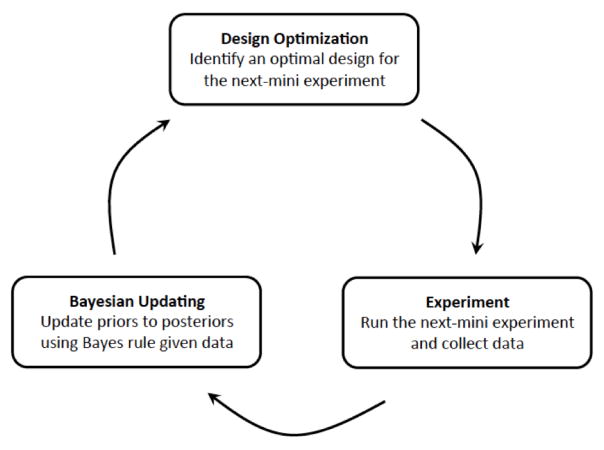
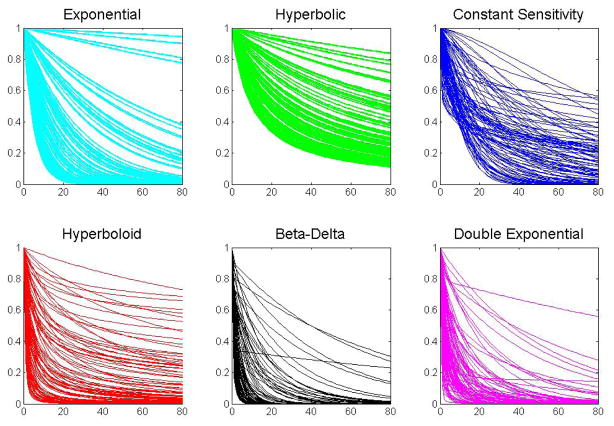
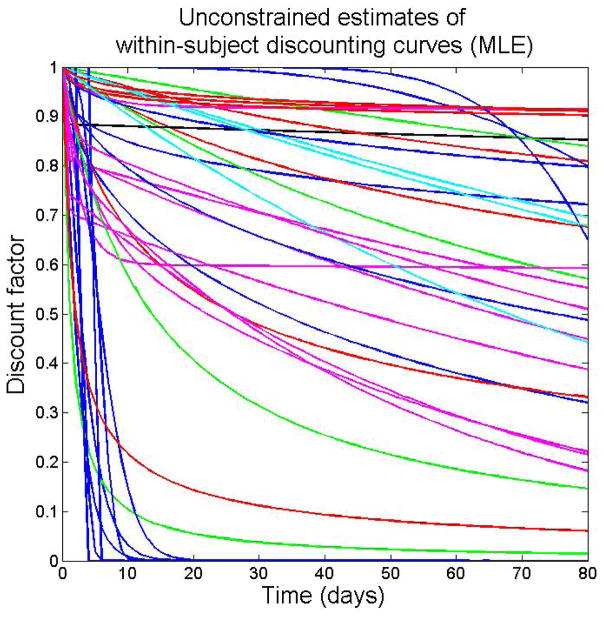
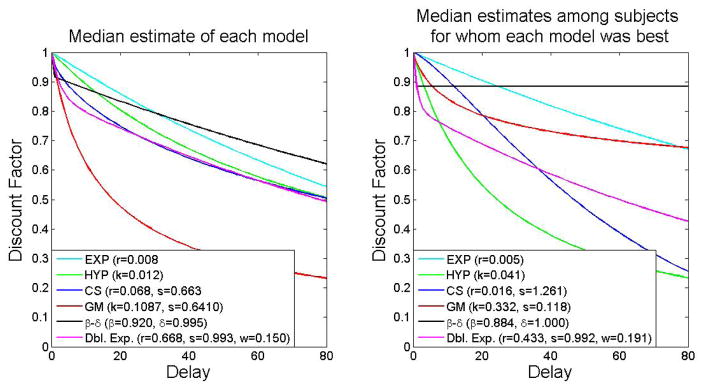
The tendency to discount the value of future rewards has become one of the best-studied constructs in the behavioral sciences. Although hyperbolic discounting remains the dominant quantitative characterization of this phenomenon, a variety of models have been proposed and consensus around the one that most accurately describes behavior has been elusive. To help bring some clarity to this issue, we propose an Adaptive Design Optimization (ADO) method for fitting and comparing models of temporal discounting. We then conduct an ADO experiment aimed at discriminating among six popular models of temporal discounting. Rather than supporting a single underlying model, our results show that each model is inadequate in some way to describe the full range of behavior exhibited across subjects. The precision of results provided by ADO further identify specific properties of models, such as accommodating both increasing and decreasing impatience, that are mandatory to describe temporal discounting broadly.
Keywords: adaptive designs; design optimization; intertemporal choice; model selection; temporal discounting.
Figures
References
-
- Abdellaoui M, Attema AE, Bleichrodt H. Intertemporal tradeoffs for gains and losses: An experimental measurement of discounted utility*. The Economic Journal. 2010;120(545):845–866.
-
- Abdellaoui M, Bleichrodt H, lHaridon O. Sign-dependence in intertemporal choice. Journal of Risk and Uncertainty. 2013;47(3):225–253.
-
- Ainslie G. Specious reward: a behavioral theory of impulsiveness and impulse control. Psychological bulletin. 1975;82(4):463. - PubMed
-
- Ainslie G, Herrnstein RJ. Preference reversal and delayed reinforcement. Animal Learning & Behavior. 1981;9(4):476–482.
-
- Akaike H. Canonical correlation analysis of time series and the use of an information criterion. Mathematics in Science and Engineering. 1976;126:27–96.
Grants and funding
LinkOut - more resources
Full Text Sources
Other Literature Sources