. 2017:2017:1969023.
doi: 10.1155/2017/1969023. Epub 2017 Dec 3.

Transient Dynamics Simulation of Airflow in a CT-Scanned Human Airway Tree: More or Fewer Terminal Bronchi?

Affiliations

Transient Dynamics Simulation of Airflow in a CT-Scanned Human Airway Tree: More or Fewer Terminal Bronchi?

Shouliang Qi et al. Comput Math Methods Med. 2017.

Abstract

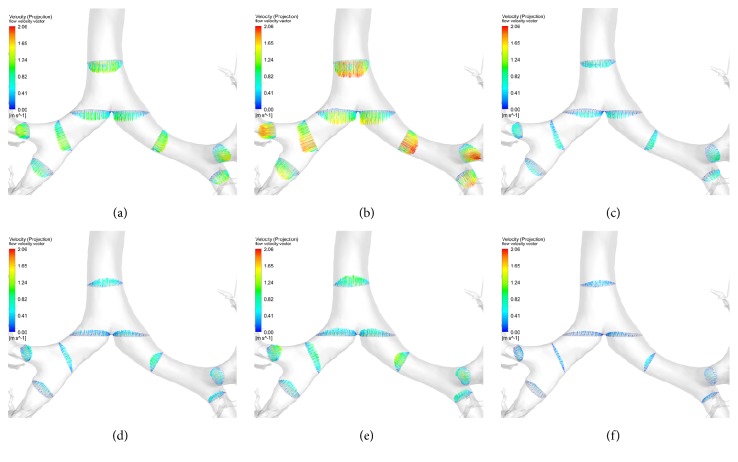
Using computational fluid dynamics (CFD) method, the feasibility of simulating transient airflow in a CT-based airway tree with more than 100 outlets for a whole respiratory period is studied, and the influence of truncations of terminal bronchi on CFD characteristics is investigated. After an airway model with 122 outlets is extracted from CT images, the transient airflow is simulated. Spatial and temporal variations of flow velocity, wall pressure, and wall shear stress are presented; the flow pattern and lobar distribution of air are gotten as well. All results are compared with those of a truncated model with 22 outlets. It is found that the flow pattern shows lobar heterogeneity that the near-wall air in the trachea is inhaled into the upper lobe while the center flow enters the other lobes, and the lobar distribution of air is significantly correlated with the outlet area ratio. The truncation decreases airflow to right and left upper lobes and increases the deviation of airflow distributions between inspiration and expiration. Simulating the transient airflow in an airway tree model with 122 bronchi using CFD is feasible. The model with more terminal bronchi decreases the difference between the lobar distributions at inspiration and at expiration.


Figures

Figure 1
Figure 1
Breathing profile in a whole respiration period (the respiratory cycle of 5.1 s, the tidal volume of 500 mL, the inspiration/expiration ratio of 1 : 2, and the inlet area of 288.28 mm2).
Figure 2
Figure 2
The validation of simulated flow velocity at the right main bronchus.
Figure 3
Figure 3
The spatial distribution of wall pressure at four time points. (a) At 0.4 s in inhaling phase; (b) at 0.8 s in inhaling phase; (c) at 2.5 s in exhaling phase; (d) at 3.4 s in exhaling phase.
Figure 4
Figure 4
The airflow velocity at different time points. (a) In the whole airway tree at 0.8 s (inhaling phase); (b) in one enlarged region (rectangle shadow in Figure 4(a)) at 0.8 s (inhaling phase); (c) in the whole airway tree at 3.4 s (exhaling phase); (d) in one enlarged region (rectangle shadow in Figure 4(c)) at 3.4 s (exhaling phase); (e) the velocity profile at cross section of the right upper lobe bronchus along X (upper-bottom); (f) the velocity profile at cross section of the right upper lobe bronchus along Y (anterior-posterior).
Figure 5
Figure 5
The wall shear stress at different time points. (a) for the whole airway tree at 0.8 s (inhaling phase); (b) for one enlarged region (rectangle shadow in Figure 5(a)) at 0.8 s (inhaling phase); (c) for the whole airway tree at 3.4 s (exhaling phase); (d) for one enlarged region (rectangle shadow in Figure 5(c)) at 3.4 s (exhaling phase).
Figure 6
Figure 6
The velocity magnitude at different cross sections of bronchi. (a) At 0.4 s in inhaling phase; (b) at 0.8 s in inhaling phase; (c) at 1.5 s in inhaling phase; (d) at 2.5 s in exhaling phase; (e) at 3.4 s in exhaling phase; (f) at 4.7 s in exhaling phase.
Figure 7
Figure 7
The velocity magnitude and vector at different cross sections of bronchi at the time point of 0.8 s in inhaling phase.
Figure 8
Figure 8
The profiles of critical parameters with time for the complete and truncated models. (a) The inlet pressure; (b) the wall pressure; (c) the maximum velocity; (d) the maximum wall shear stress.
Figure 9
Figure 9
The flow patterns presented using streamline. (a) At inspiration for the complete model; (b) at expiration for the complete model; (c) at inspiration for the truncated model; (d) at expiration for the truncated model.
Figure 10
Figure 10
Lobar distribution of air, the lobar volume ratio, and the outlet area ratio. (a) The complete model; (b) the truncated model.

References

    1. Laroia A. T. Modern imaging of the tracheo-bronchial tree. World Journal of Radiology. 2010;2(7):p. 237. doi: 10.4329/wjr.v2.i7.237. - DOI - PMC - PubMed
    1. Pu J., Gu S., Liu S., et al. CT based comput-erized identification and analysis of human airways: a review. Medical Physics. 2012;39(5):2603–2616. doi: 10.1118/1.4703901. - DOI - PMC - PubMed
    1. Nakano Y., Van Tho N., Yamada H., Osawa M., Nagao T. Radiological approach to asthma and COPD-the role of computed tomography. Allergology International. 2009;58(3):323–331. doi: 10.2332/allergolint.09-RAI-0124. - DOI - PubMed
    1. Hoffman E. A., Simon B. A., McLennan G. A structural and functional assessment of the lung via multidetector-row computed tomography: Phenotyping chronic obstructive pulmonary disease. Proceedings of the American Thoracic Society. 2006;3(6):519–532. doi: 10.1513/pats.200603-086MS. - DOI - PMC - PubMed
    1. Hackx M., Bankier A. A., Gevenois P. A. Chronic obstructive pulmonary disease: CT quantification of airways disease. Radiology. 2012;265(1):34–48. doi: 10.1148/radiol.12111270. - DOI - PubMed