. 2018;11(2):121-126.
doi: 10.1038/s41561-017-0033-0. Epub 2018 Jan 8.

Response of Pacific-sector Antarctic ice shelves to the El Niño/Southern Oscillation

Affiliations

Response of Pacific-sector Antarctic ice shelves to the El Niño/Southern Oscillation

F S Paolo et al. Nat Geosci. 2018.

Abstract

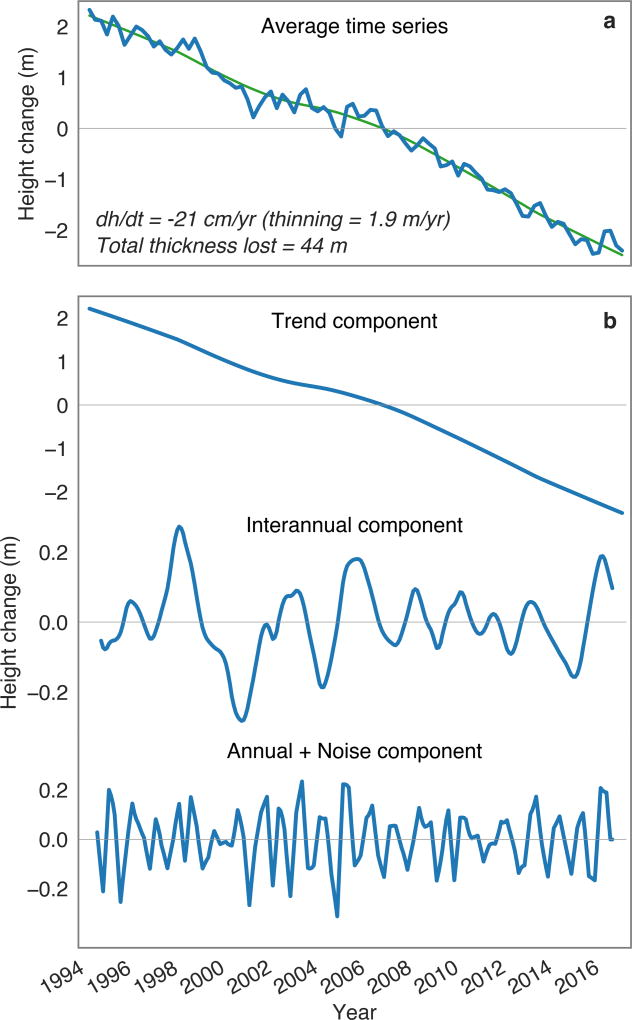
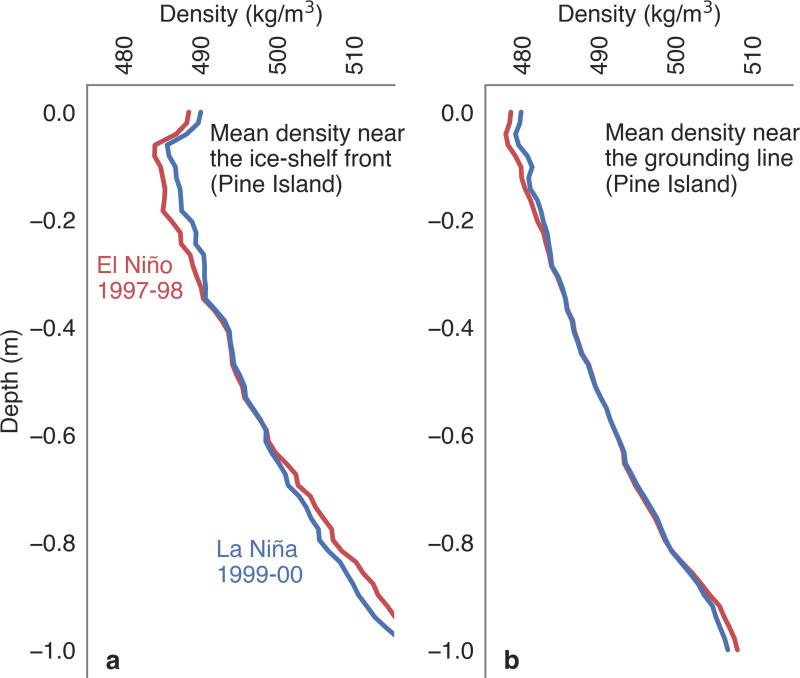
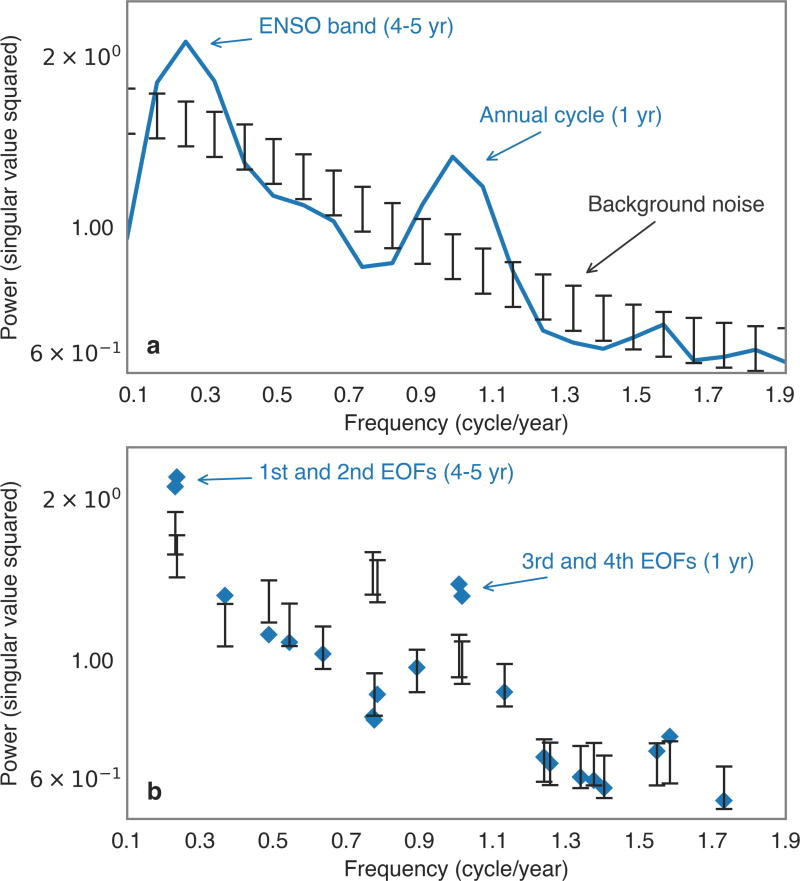
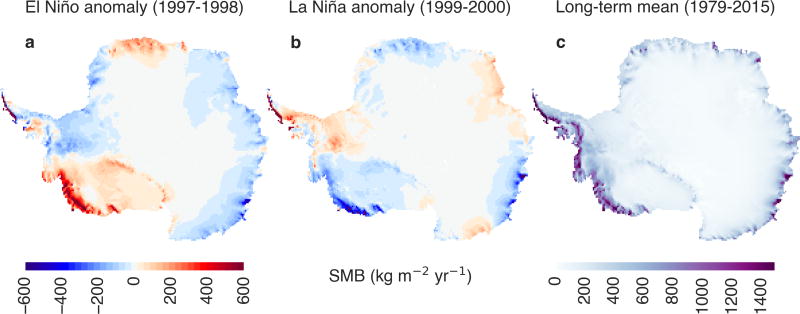
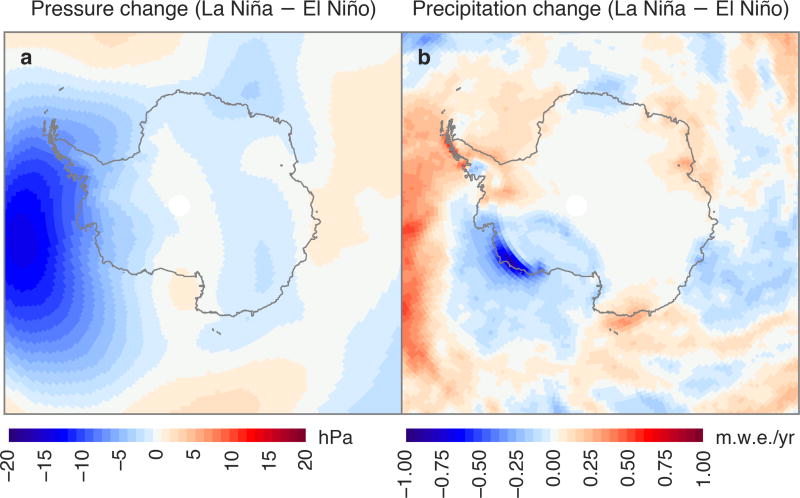
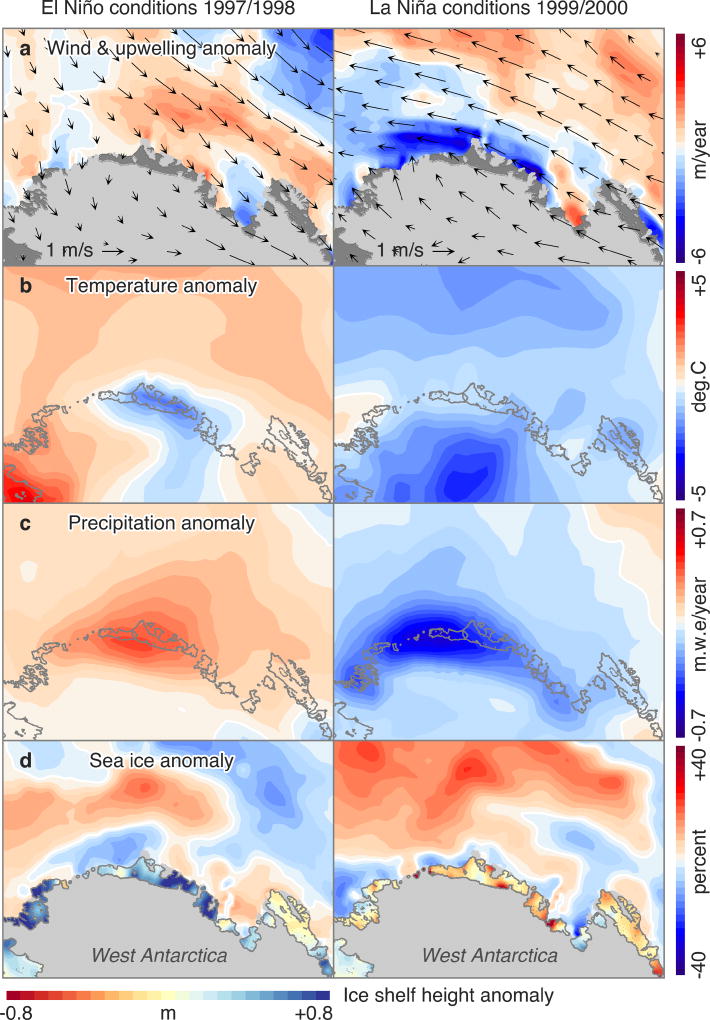
Satellite observations over the past two decades have revealed increasing loss of grounded ice in West Antarctica, associated with floating ice shelves that have been thinning. Thinning reduces an ice-shelf's ability to restrain grounded-ice discharge, yet our understanding of the climate processes that drive mass changes is limited. Here, we use ice-shelf height data from four satellite altimeter missions (1994-2017) to show a direct link between ice-shelf-height variability in the Antarctic Pacific sector and changes in regional atmospheric circulation driven by the El Niño-Southern Oscillation. This link is strongest from Dotson to Ross ice shelves and weaker elsewhere. During intense El Niño years, height increase by accumulation exceeds the height decrease by basal melting, but net ice-shelf mass declines as basal ice loss exceeds lower-density snow gain. Our results demonstrate a substantial response of Amundsen Sea ice shelves to global and regional climate variability, with rates of change in height and mass on interannual timescales that can be comparable to the longer-term trend, and with mass changes from surface accumulation offsetting a significant fraction of the changes in basal melting. This implies that ice-shelf height and mass variability will increase as interannual atmospheric variability increases in a warming climate.


Conflict of interest statement

Competing financial interests The authors declare no competing financial interests.

Figures

Extended Data Figure 1
Extended Data Figure 1. Average trend and variability in Amundsen Sea ice-shelf height
a, Average of all time-series of ice-shelf height change, relative to zero mean, in the Amundsen Sea (AS) sector. Green line shows trend component. b, Decomposition of average AS time series into its trend, interannual, and annual-plus-noise components. The ‘Annual + Noise’ component includes the residual of seasonal variation in backscatter after standard correction (for variation in ice-surface properties) was applied . The interannual component has higher energy content than the annual component (see power spectrum, Extended Data Fig. 5).
Extended Data Figure 2
Extended Data Figure 2. Spatial pattern of correlation between wind, sea ice and ONI
Correlation between the Oceanic Nino Index and anomalies in: a, the zonal (westerly) component of the wind, associated with upwelling/downwelling of CDW underneath the ice shelves; b, the meridional (southerly) component of the wind, associated with transport of warm moist/cold dry air between the open ocean and West Antarctica; c, sea-ice concentration. Correlations are between 12-month running integrals of ONI and wind records (without lag; a and b) and 12-month running mean of sea ice (lagged by 4–6 months; c). See Extended Data Fig. 6 for similar (panel b) “reversed” pattern in SMB between the AS and BS-AP sectors.
Extended Data Figure 3
Extended Data Figure 3. Oceanic and atmospheric contribution to ice-shelf height change between El Niño and La Niña
(Same as Fig. 4 but now using ERA-Interim precipitation directly instead of RACMO2.3-based SMB) a, Measured ice-shelf height (anomaly) from altimetry; b, atmospheric pressure (IBE) from ERA-Interim (pressure decrease: height increase); c, SMB derived from ERA-Interim (reduction in accumulation: height decrease); d, melt rate inferred from the previous three: d = abc (reduction in melting: height increase). SMB was converted to buoyancy-compensated height-equivalent using firn density of 490 kg/m3 for visualization purposes. The color map depicts the sign of each contribution to the measured height change (anomaly during La Niña minus that of El Niño).
Extended Data Figure 4
Extended Data Figure 4. Modeled surface density profiles
Mean density (1-year average) of the firn layer (0 to 1 m depth). Two different epochs: El Niño of 1997–1998 (red) and La Niña of 1999–2000 (blue), on Pine Island Glacier ice-shelf front (a) and grounding line (b). These profiles are from a firn densification model , and are representative of the AS ice shelves (i.e. mean firn density varies smoothly from ice shelf to ice shelf in the AS). The density of fresh snow is constant with time in the model, although it does vary spatially as a function of temperature, accumulation rate and wind speed .
Extended Data Figure 5
Extended Data Figure 5. Power spectrum of changes in AS ice-shelf height
Spectrum of AS ice-shelf height changes estimated from 77 time series, using multivariate Singular Spectrum Analysis (SSA). a, Spectral energy distributed along regularly sampled frequencies. b, Significance of each eigenvalue (mode of variability, or EOF) as identified by SSA. Error bars are 95% confidence intervals for the estimated background noise. Eigenvalues above the error bars are statistically significant. Pairs of EOFs with the same frequency represent an oscillation identified by SSA. The characteristic frequency of each EOF is obtained by least-square fitting the corresponding EOF to a sine function. The noise spectra were produced with a Monte-Carlo approach .
Extended Data Figure 6
Extended Data Figure 6. Antarctic surface mass balance during El Niño and La Niña
a, Anomaly in surface mass balance (SMB) during El Nino of 1997–1998 and, b, during La Nina of 1999–2000 (reversed pattern), from a regional climate model (RACMO2.3) . The AS sector shows the strongest ENSO-driven anomaly in SMB of the entire Antarctic continent, consistent with the ENSO-driven anomaly in precipitation (from ERA-Interim; Extended Data Fig. 7). c, The largest precipitation (and surface density) values in Antarctica occur along the West Antarctic coast as evidenced by the long-term mean SMB (and Fig. 7 in Ligtenberg et al.) .
Extended Data Figure 7
Extended Data Figure 7. Change in pressure and precipitation Antarctica-wide
Circum-Antarctic change in sea level pressure (a) and precipitation (b) between the El Niño of 1997– 1998 and La Niña of 1999–2000. These large-scale patterns show that ENSO-driven anomalies are localized: pressure (the Amundsen Sea Low) changing over the Amundsen-Bellingshausen Sea, and precipitation changing substantially over the Amundsen Sea ice shelves. Fields were derived from the ERA-Interim reanalysis .
Extended Data Figure 8
Extended Data Figure 8. Amundsen Sea Low during El Niño and La Niña years
Changes in intensity of the Amundsen Sea Low (ASL) pressure system during El Niño and La Niña years within 1994–2017 (derived from ERA-Interim). The ASL changes consistently between El Niño years (positive anomaly / weaker ASL) and La Niña years (negative anomaly / deeper ASL). Each panel matches (approximately) a moderate-to-strong El Niño and La Niña year as defined by NOAA [and depicted in the Oceanic Niño Index, Fig. 1: 1997.7 (EN), 1999.0 (LN), 2002.5 (EN), 2008.5 (LN), 2009.8 (EN), 2011.2 (LN), and 2015.9 (EN)].
Figure 1
Figure 1. Relationship between ice-shelf height anomalies and ENSO index
a, AS averaged ice-shelf height anomaly (12-month running mean; blue curve; top horizontal bars denote the time period of each satellite mission), 1-sigma bounds from 2000 bootstrap samples are plotted as dashed lines. Red line is the best fit between the height record and a combination of (12-month running integral) Oceanic Niño Index (ONI) and Amundsen Sea Low relative central pressure (ASL), both lagged by 4–6 months (preceding height); b, ONI; colored areas denote moderate-to-very-strong El Niños (red) and La Niñas (blue) as defined by NOAA (http://ggweather.com/enso/oni.htm).
Figure 2
Figure 2. Spatial pattern of correlation between wind and ice-shelf height anomalies
Correlation between 12-month running means of ice-shelf height anomalies in the AS (ice shelves in dark red) for the period 1994–2017 and 12-month running integrals of wind anomalies from ERA-Interim reanalysis for: a, the zonal (westerly) component,; b, the meridional (southerly) component. Wind anomalies (preceding ice-shelf height changes) were lagged by 4–6 months. The arrows indicate the direction of the wind anomaly that correlates with increase in ice-shelf height (e.g. in panel b, negative correlation between meridional wind and ice-shelf height means that onshore wind correlates with increase in height).
Figure 3
Figure 3. Average oceanic, atmospheric and ice-shelf conditions during two distinct ENSO phases: El Niño (1997–1998) and La Niña (1999–2000)
Annual-average anomalies in local oceanic, atmospheric and ice-shelf conditions for 1997–1998 (left) and 1999–2000 (right). From top to bottom: a, wind velocity vectors, and vertical transport of coastal waters (upwelling/downwelling) derived from the wind-stress curl; b, air temperature; c, precipitation rate; d, observed sea-ice concentration, and ice-shelf height anomaly (six months after peak ENSO activity; see Methods). Fields in panels a–c are from ERA-Interim reanalysis. Surface mass balance and sea-level pressure during these conditions are shown in Extended Data Figs. 6, 7 and 8.
Figure 4
Figure 4. Oceanic and atmospheric contributions to ice-shelf height anomalies between El Niño (1997–1998) and La Niña (1999–2000)
a Altimetry-derived ice-shelf height changes (La Niña minus El Niño); b height change due to atmospheric pressure, derived from ERA-Interim (pressure decrease: height increase); c surface mass balance from RACMO2.3, for visualization purposes, surface mass balance was converted to buoyancy-compensated height-equivalent using surface density of 490 kg/m3 (accumulation decrease: height decrease); d basal mass change inferred from the previous three: d = abc (melting decrease: height increase).
Figure 5
Figure 5. Relative influence of ENSO along the Antarctic Pacific margin
a, Regional variation of the “similarity index” (size and color of squares) between ice-shelf height-anomaly records and the time-integrated Oceanic Niño Index (ONI). b, 12-month running integral of ONI (i.e. ENSO) lagged by 4–6 months (top plot) and 12-month running means of ice-shelf height anomalies for the AS (AMU) and six individual ice shelves, the shaded area highlights the large height change resulting from the 1997–2001 El Niño-to-La Niña transition. Ice shelves are: Pine Island (PIG), Dotson (DOT), Getz (GET), Nickerson (NIC), Sulzberger (SUL), and Ross (ROS).

References

    1. Church JA, et al. Climate Change 2013: The Physical Science Basis. In: Stocker TF, et al., editors. Contribution of Working Group I to the Fifth Assessment Report of the Intergovernmental Panel on Climate Change. 2013. pp. 1137–1177.
    1. Fretwell P, et al. Bedmap2: improved, ice bed, surface and thickness datasets for Antarctica. The Cryosphere. 2013;7:375–393.
    1. Bamber JL, Riva REM, Vermeersen BLA, LeBrocq AM. Reassessment of the Potential Sea-Level Rise from a Collapse of the West Antarctic Ice Sheet. Science. 2009;324:901–903. - PubMed
    1. Favier L, et al. Retreat of Pine Island Glacier controlled by marine ice-sheet instability. Nat. Clim. Change. 2014;4:117–121.
    1. Joughin I, Smith BE, Medley B. Marine Ice Sheet Collapse Potentially Under Way for the Thwaites Glacier Basin, West Antarctica. Science. 2014;344:735–738. - PubMed