. 2017 Dec 28;2(4):e000370.
doi: 10.1136/bmjgh-2017-000370. eCollection 2017.

Relationship between growth and illness, enteropathogens and dietary intakes in the first 2 years of life: findings from the MAL-ED birth cohort study

Collaborators

Relationship between growth and illness, enteropathogens and dietary intakes in the first 2 years of life: findings from the MAL-ED birth cohort study

MAL-ED Network Investigators. BMJ Glob Health. .

Abstract

Background: Dietary and illness factors affect risk of growth faltering; the role of enteropathogens is less clear. As part of the Etiology, Risk Factors and Interactions of Enteric Infections and Malnutrition and the Consequences for Child Health and Development (MAL-ED) study, we quantify the effects of enteropathogen infection, diarrhoea and diet on child growth.

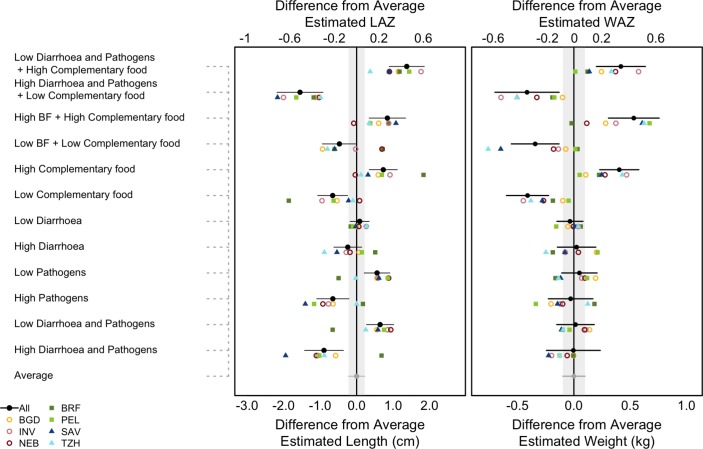
Methods: Newborns were enrolled and followed until 24 months. Length and weight were assessed monthly. Illnesses and breastfeeding practices were documented biweekly; from 9 to 24 months, non-breast milk intakes were quantified monthly. Routinely collected non-diarrhoeal stools were analysed for a broad array of enteropathogens. A linear piecewise spline model was used to quantify associations of each factor with growth velocity in seven of eight MAL-ED sites; cumulative effects on attained size at 24 months were estimated for mean, low (10th percentile) and high (90th percentile) exposure levels. Additionally, the six most prevalent enteropathogens were evaluated for their effects on growth.

Results: Diarrhoea did not have a statistically significant effect on growth. Children with high enteropathogen exposure were estimated to be 1.21±0.33 cm (p<0.001; 0.39 length for age (LAZ)) shorter and 0.08±0.15 kg (p=0.60; 0.08 weight-for-age (WAZ)) lighter at 24 months, on average, than children with low exposure. Campylobacter and enteroaggregativeEscherichia coli detections were associated with deficits of 0.83±0.33 and 0.85±0.31 cm in length (p=0.011 and 0.001) and 0.22±0.15 and 0.09±0.14 kg in weight (p=0.14 and 0.52), respectively. Children with low energy intakes and protein density were estimated to be 1.39±0.33 cm (p<0.001; 0.42 LAZ) shorter and 0.81±0.15 kg (p<0.001; 0.65 WAZ) lighter at 24 months than those with high intakes.

Conclusions: Reducing enteropathogen burden and improving energy and protein density of complementary foods could reduce stunting.

Keywords: child health; cohort study; environmental health; nutritional and metabolic disorders; pneumonia.


Conflict of interest statement

Competing interests: None declared.

Figures

Figure 1
Figure 1
(Left) The predicted difference in length (bottom axis) and length-for-age z-score (LAZ) (top axis) and (right) weight (bottom axis) and weight-for-age z-score (WAZ) (top axis) at 24 months between scenarios that alter potential risk factors and a scenario based on the average experience of children in the cohort. Absolute length and weight were converted into Z-scores using the WHO Growth Standards. The high and low scenarios are based on changing the named variable(s) to the 90th and 10th percentiles of their observed distribution respectively while holding all other variables at their mean level. BF refers to % days of full breast feeding from 0 to 5 months, and complementary food refers to the % of days fed animal milks and dairy between 3 and 8 months, and energy and (energy-adjusted) protein intakes from non-breast milk foods from 9 to 24 months. Horizontal lines indicate the 95% CI around the mean differences. The grey vertical bars indicate the 95% CI around the average estimate (which has 0 difference from itself). Site-specific models used 10th and 90th percentiles for risk factors that were specific to the site. Sites: BGD, Bangladesh (Dhaka); INV, India (Vellore); NEB, Nepal (Bhaktapur); BRF, Brazil (Fortaleza); PEL, Peru (Loreto); SAV, South Africa (Venda); TZH, Tanzania (Haydom).
Figure 2
Figure 2
The predicted difference in length (bottom axis) and LAZ (top axis) (left) and weight (bottom axis) and WAZ (top axis) (right) at 24 months based on scenarios that change individual factors potentially affecting growth velocity adjusting for the mean of all factors. The absolute length and weight were converted to z-scores for length-for age (LAZ) and weight-for-age (WAZ) using the WHO Growth Standards. The high and low scenarios are based on presence or absence of the named pathogen in at least one surveillance stool in each period while holding all other variables at their mean level. The pathogens represented here are the top three pathogens by prevalence (Campylobacter, EAEC and Giardia). Horizontal lines indicate the 95% CI around the mean differences. The grey vertical bars indicate the 95% CI around the average estimate (which has 0 difference from itself). Sites: BGD, Bangladesh (Dhaka); INV, India (Vellore); NEB, Nepal (Bhaktapur); BRF, Brazil (Fortaleza) PEL, Peru (Loreto); SAV, South Africa (Venda); TZH, Tanzania (Haydom). EAEC, enteroaggregative Escherichia coli.

References

    1. Olofin I, McDonald CM, Ezzati M, et al. Associations of suboptimal growth with all-cause and cause-specific mortality in children under five years: a pooled analysis of ten prospective studies. PLoS One 2013;8:e64636 10.1371/journal.pone.0064636 - DOI - PMC - PubMed
    1. Black RE, Allen LH, Bhutta ZA, et al. Maternal and child undernutrition: global and regional exposures and health consequences. Lancet 2008;371:243–60. 10.1016/S0140-6736(07)61690-0 - DOI - PubMed
    1. Hoddinott J, Behrman JR, Maluccio JA, et al. Adult consequences of growth failure in early childhood. Am J Clin Nutr 2013;98:1170–8. 10.3945/ajcn.113.064584 - DOI - PMC - PubMed
    1. United Nations Children’s Fund. Strategy for improved nutrition of children and women in developing countries. New York, USA: United Nations Children’s Fund, 1990. - PubMed
    1. Scrimshaw NS, Taylor CE, Gordon JE. Interactions of nutrition and infection. Monogr Ser World Health Organ 1968;57:3–329. - PubMed