. 2017;1(5):0071.
doi: 10.1038/s41551-017-0071. Epub 2017 May 10.

Single-impulse Panoramic Photoacoustic Computed Tomography of Small-animal Whole-body Dynamics at High Spatiotemporal Resolution

Affiliations

Single-impulse Panoramic Photoacoustic Computed Tomography of Small-animal Whole-body Dynamics at High Spatiotemporal Resolution

Lei Li et al. Nat Biomed Eng. 2017.

Abstract

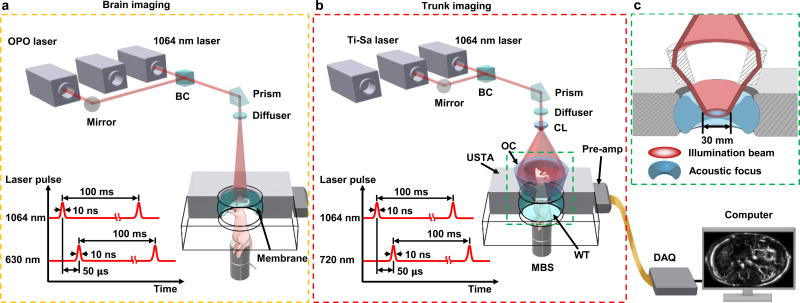
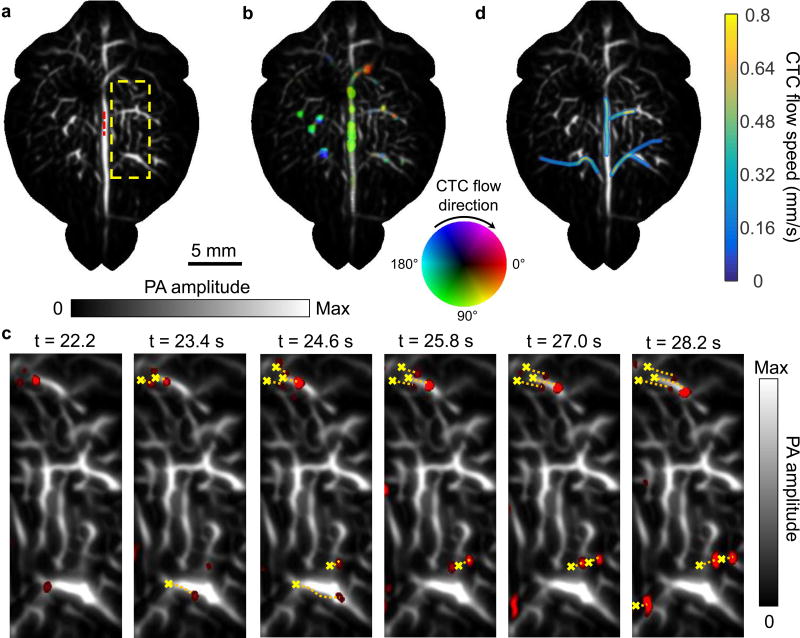
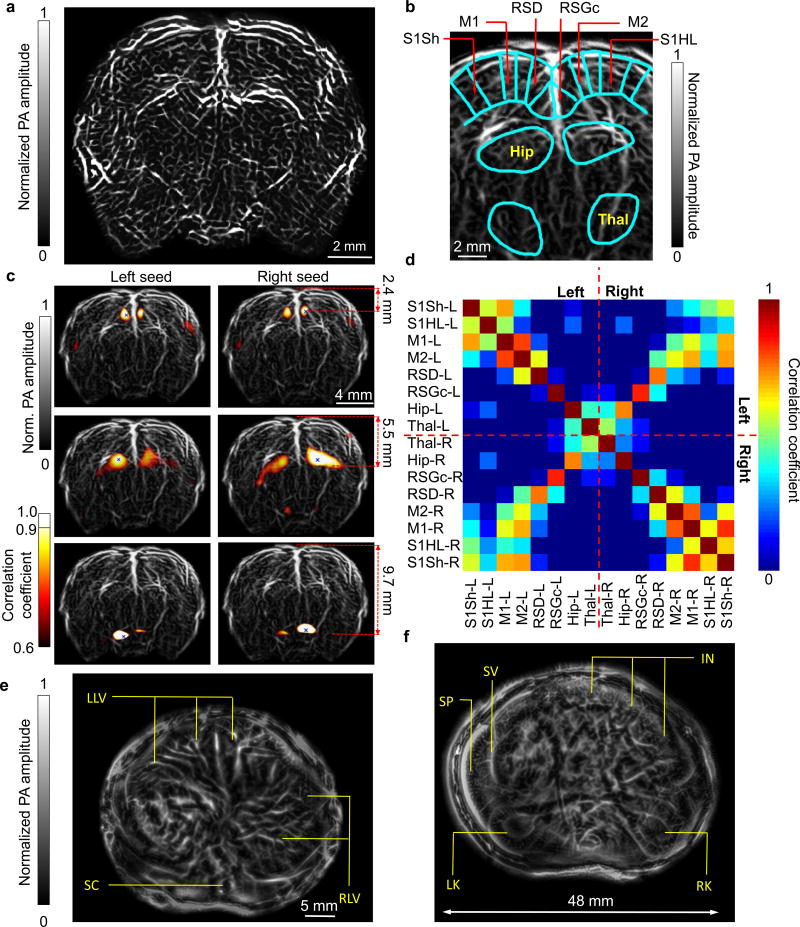
Imaging of small animals has played an indispensable role in preclinical research by providing high dimensional physiological, pathological, and phenotypic insights with clinical relevance. Yet pure optical imaging suffers from either shallow penetration (up to ~1-2 mm) or a poor depth-to-resolution ratio (~1/3), and non-optical techniques for whole-body imaging of small animals lack either spatiotemporal resolution or functional contrast. Here, we demonstrate that standalone single-impulse photoacoustic computed tomography (SIP-PACT) mitigates these limitations by combining high spatiotemporal resolution (125-µm in-plane resolution, 50 µs / frame data acquisition and 50-Hz frame rate), deep penetration (48-mm cross-sectional width in vivo), anatomical, dynamical and functional contrasts, and full-view fidelity. By using SIP-PACT, we imaged in vivo whole-body dynamics of small animals in real time and obtained clear sub-organ anatomical and functional details. We tracked unlabeled circulating melanoma cells and imaged the vasculature and functional connectivity of whole rat brains. SIP-PACT holds great potential for both pre-clinical imaging and clinical translation.


Conflict of interest statement

COMPETING FINANCIAL INTERESTS L.V.W. and K.M. have a financial interest in Microphotoacoustics, Inc., which, however, did not support this work. The other authors declare no competing financial interests.

Figures

Figure 1
Figure 1
Schematics of the SIP-PACT system for (a) brain and (b) trunk imaging. During dual-wavelength illumination, all lasers fire at 10 Hz and the delay time between the dual-pulse is 50 µs. For single-wavelength illumination, the 1064-nm laser fires at 50 Hz and the Ti: Sapphire (Ti-Sa) laser fires at 20 Hz. BC, beam combiner; CL, conical lens; MBS, magnetic base scanner; OC, optical condenser; USTA, (full-ring) ultrasonic transducer array; WT, water tank. (c) Close up of the green dashed box region in (b), which shows the confocal design of light delivery and PA wave detection.
Figure 2
Figure 2
Label-free SIP-PACT of small-animal whole-body anatomy from the brain to the trunk (Supplementary Video 1). (a) Vasculature of the brain cortex; SSS, superior sagittal sinus. (b) Cross-sectional image of the upper thoracic cavity (Supplementary Video 2); HT, heart; LL, left lung; RL, right lung; ST, sternum. (c) Cross-sectional image of lower thoracic cavity (Supplementary Video 3); LV, liver; TA, thoracic aorta; VE, vertebra. (d) Cross-sectional image of two lobes of liver (Supplementary Video 4); AA, abdominal aorta; IVC, inferior vena cava; LLV, left lobe of liver; PV, portal vein; RLV, right lobe of liver. (e) Cross-sectional image of upper abdominal cavity (Supplementary Video 5); IN, intestines; SC, spinal cord; SP, spleen; SV, splenic vein. (f) Cross-sectional imaging of lower abdominal cavity (Supplementary Video 6); BM, backbone muscles; CM, cecum; LK, left kidney; RK, right kidney.
Figure 3
Figure 3
Label-free imaging of small-animal whole-body dynamics. (a) Cross-sectional image of the upper thoracic cavity, where the red solid line crosses a rib, and the blue dashed line crosses the heart wall. (b) Line profiles in (a) versus time show the displacements of (upper panel) the rib during respiration and (lower panel) the heart wall during heartbeats. The traces of the rib and heart wall movements are identified and highlighted with solid red lines. (c) Fourier transforms of the rib and heart wall movements showing the respiratory frequency and heartbeat frequency, respectively. (d) Heartbeat encoded arterial network mapping overlaid on the anatomical image. (e) Cross-sections of the vessels highlighted by arrows in (d), showing changes associated with arterial pulse propagation (Supplementary Video 8). (f) A zoomed-in of the dashed box in (e) shows the relative phase delay between the two curves of the vessels’ cross sections.
Figure 4
Figure 4
SIP-PACT of mouse whole-body oxygenation dynamics. sO2 mapping of mouse cortical vasculatures during (a) hyperoxia and (b) hypoxia. (c) Brain sO2 changes during oxygen challenges, the gray rectangle outlines the challenge periods (Supplementary Video 9) (d). Changes in concentrations of oxy-hemoglobin and deoxy-hemoglobin during oxygen challenges, the gray rectangle outlines the challenge periods. (e) Fractional changes in blood oxygen level in the cross-sectional image of the lower abdominal cavity (Supplementary Video 10). (f) Normalized PA amplitude, corresponding to blood oxygen level, in internal organs during hyperoxia and hypoxia, where the hollow bars represent the baseline amplitudes and the solid bars represent the plateau amplitudes during challenge (n = 50, error bars are s.e.m.). The p values were calculated by paired Student’s t-test. See Online Methods for details of this statistical analysis.
Figure 5
Figure 5
Label-free tracking of CTCs in the mouse brain in vivo (Supplementary Video 11). (a) Baseline cortical vasculature before the injection of melanoma cancer cells, under 680-nm excitation. (b) PA imaging of the mouse cortex after injection of melanoma cancer cells, where colors represent CTCs’ flow direction. Flow speed is radially encoded in the color disk by hue saturation (a greater radius indicates faster) (c) Tracking the flowing of cancer cells, where red highlights the moving cancer cells in the current frame, yellow crosses show their initial positions, and the orange dashed lines represent the CTCs’ flowing traces. (d) Flow speed distribution of CTCs in segmented cortical vessels.
Figure 6
Figure 6
Deep imaging of rat whole brain functions and whole-body anatomy. (a) Rat whole brain vasculature in the coronal plane. (b) Segmentations of different functional regions of the brain. (c) Seed-based functional connectivity analyses of RSGc (top row), Hippocampus (middle row), and Thalamus (bottom row) regions on both sides of the brain. (d) Correlation matrix of the 16 functional regions labeled in (b). Notice the correlation between left and right hemispheres, as well as the correlation across different regions in the neocortex. S1Sh, primary somatosensory–shoulder region; S1HL, primary somatosensory cortex–hindlimb region; M1, primary motor cortex; M2, secondary motor cortex; RSD, retrosplenial dysgranular cortex; RSGc, retrosplenial granular cortex; Hip, hippocampus; Thal, thalamus. (e) and (f) Cross-sectional images of a rat whole-body (Supplementary Video 13). IN, intestine; LK, left kidney; LLV, left liver; RK, right kidney; RLV, right liver; SC, spinal cord; SP, spleen; SV, splenic vein.

References

    1. Baker M. Whole-animal imaging: The whole picture. Nature. 2010;463:977–980. - PubMed
    1. Zanzonico P. In: Small Animal Imaging: Basics and Practical Guide. Kiessling F, Pichler JB, editors. Springer Berlin Heidelberg; Berlin, Heidelberg: 2011. pp. 3–16.
    1. Ntziachristos V. Going deeper than microscopy: the optical imaging frontier in biology. Nature Methods. 2010;7:603–614. - PubMed
    1. Jun X, Wang LV. Small-Animal Whole-Body Photoacoustic Tomography: A Review. IEEE Transactions on Biomedical Engineering. 2014;61:1380–1389. - PMC - PubMed
    1. Wu D, Zhang J. In vivo mapping of macroscopic neuronal projections in the mouse hippocampus using high-resolution diffusion MRI. NeuroImage. 2016;125:84–93. - PMC - PubMed