. 2018 Apr;61(4):942-953.
doi: 10.1007/s00125-017-4526-6. Epub 2018 Jan 14.

Unique metabolic activation of adipose tissue macrophages in obesity promotes inflammatory responses

Affiliations

Unique metabolic activation of adipose tissue macrophages in obesity promotes inflammatory responses

Lily Boutens et al. Diabetologia. 2018 Apr.

Abstract

Aims/hypothesis: Recent studies have identified intracellular metabolism as a fundamental determinant of macrophage function. In obesity, proinflammatory macrophages accumulate in adipose tissue and trigger chronic low-grade inflammation, that promotes the development of systemic insulin resistance, yet changes in their intracellular energy metabolism are currently unknown. We therefore set out to study metabolic signatures of adipose tissue macrophages (ATMs) in lean and obese conditions.

Methods: F4/80-positive ATMs were isolated from obese vs lean mice. High-fat feeding of wild-type mice and myeloid-specific Hif1α-/- mice was used to examine the role of hypoxia-inducible factor-1α (HIF-1α) in ATMs part of obese adipose tissue. In vitro, bone marrow-derived macrophages were co-cultured with adipose tissue explants to examine adipose tissue-induced changes in macrophage phenotypes. Transcriptome analysis, real-time flux measurements, ELISA and several other approaches were used to determine the metabolic signatures and inflammatory status of macrophages. In addition, various metabolic routes were inhibited to determine their relevance for cytokine production.

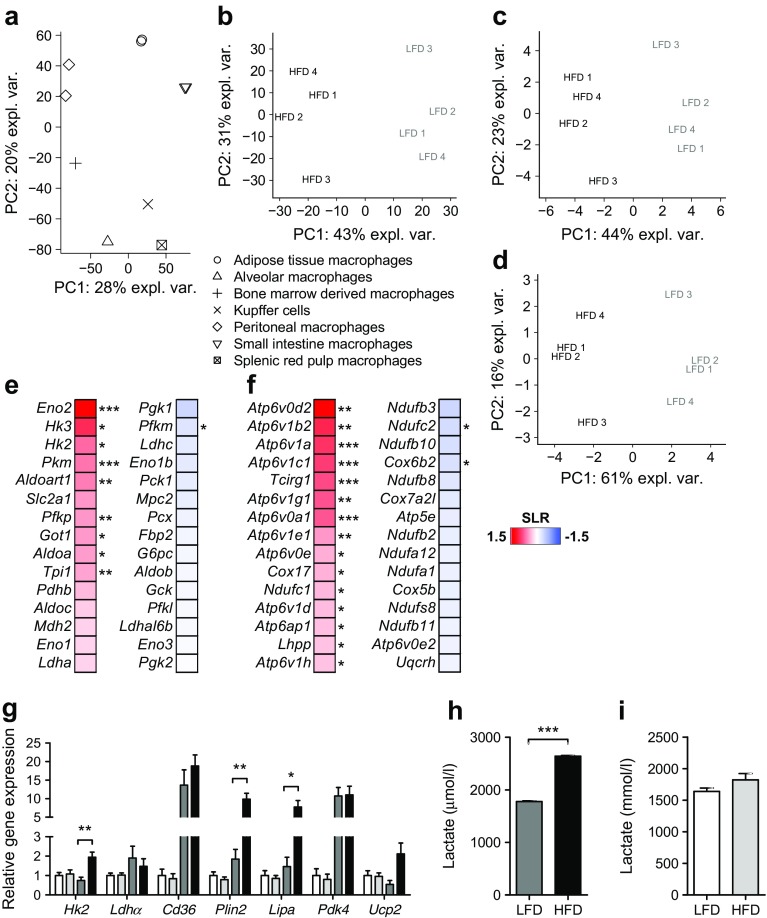
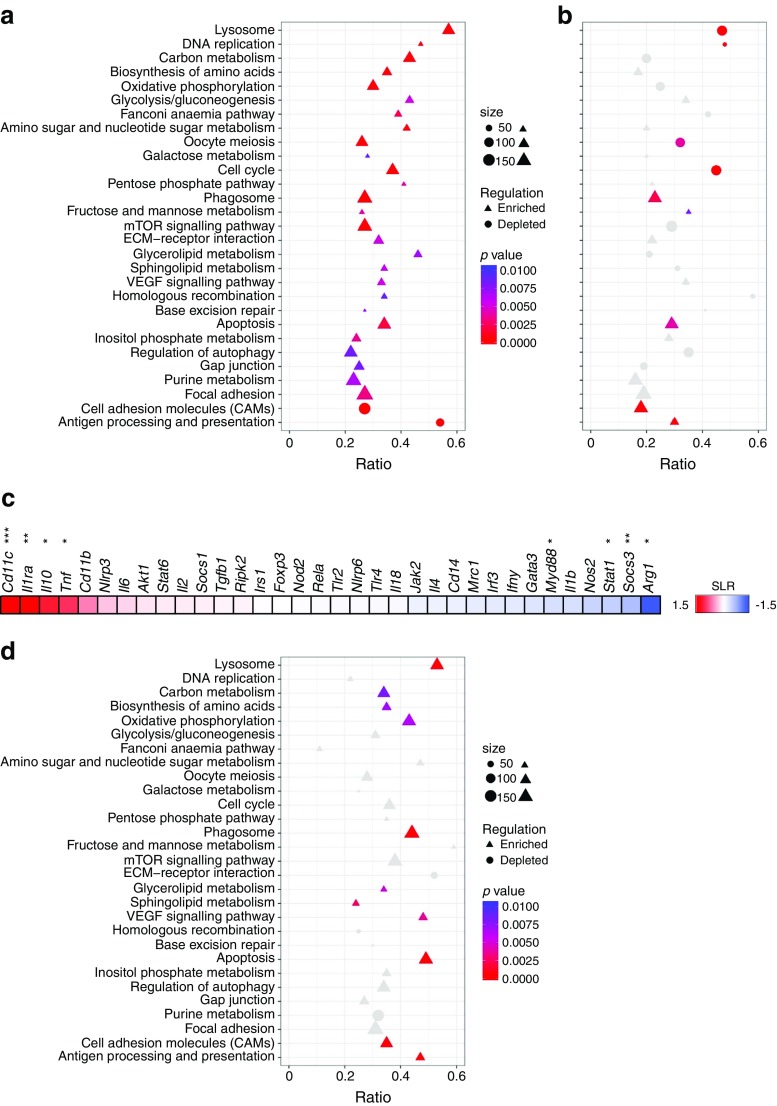
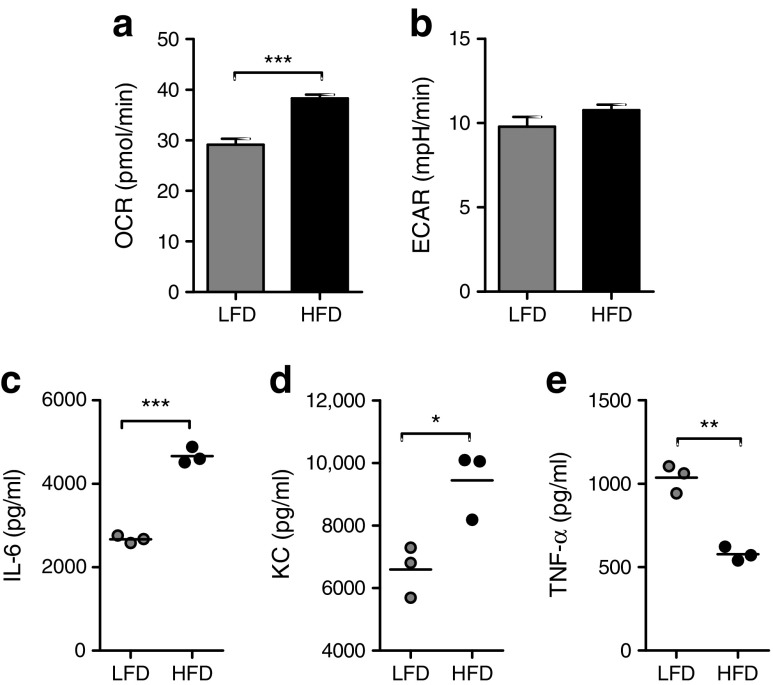
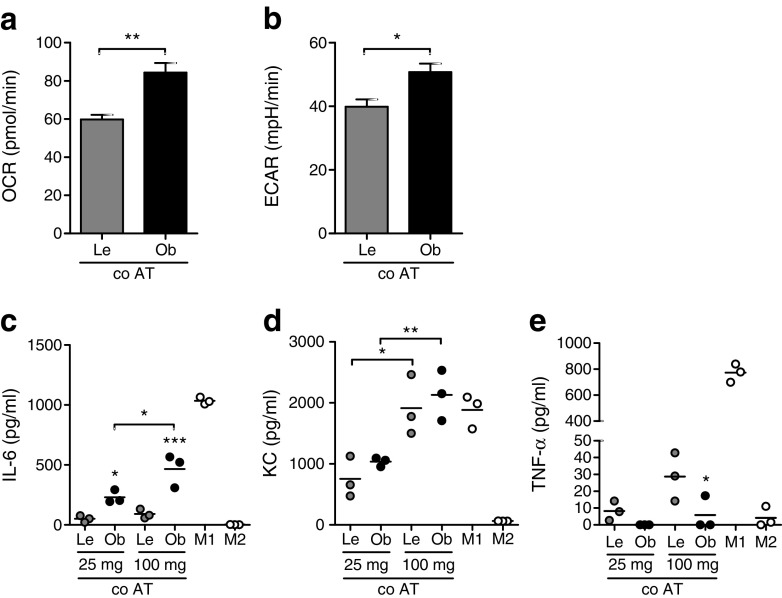
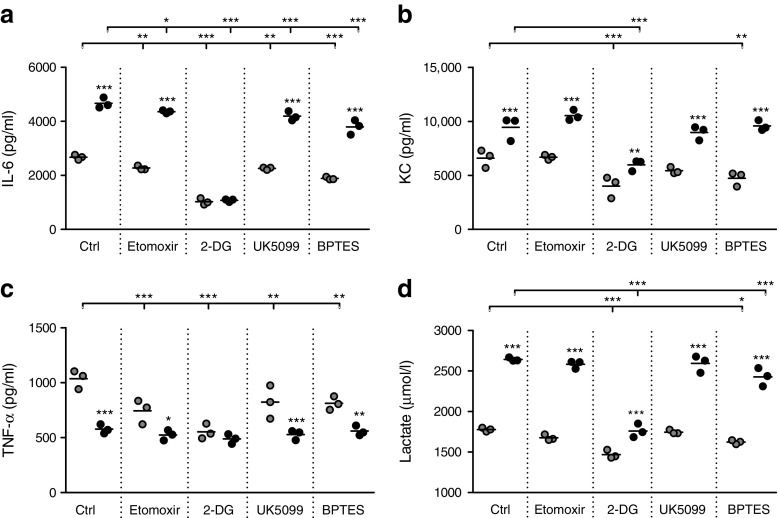
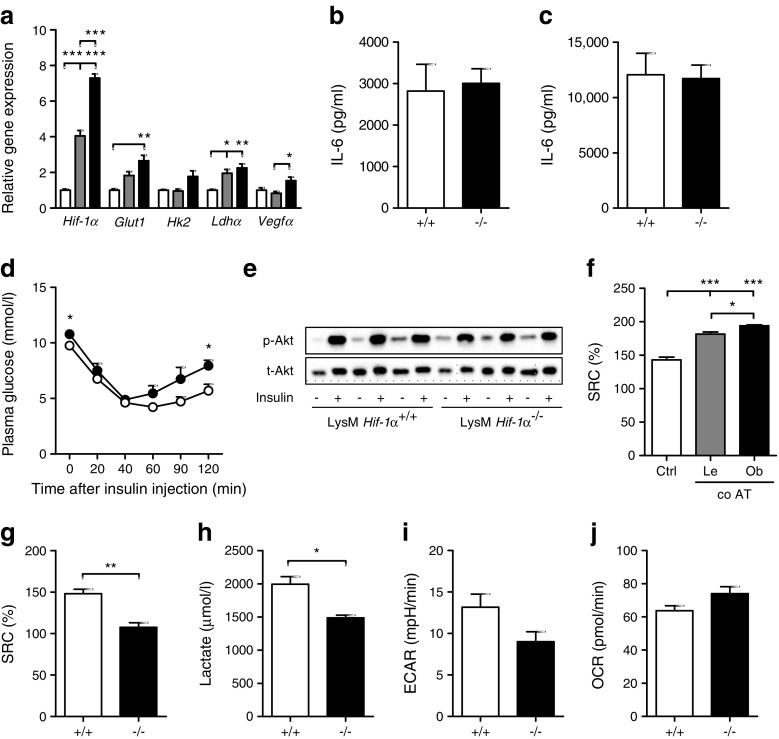
Results: Transcriptome analysis and extracellular flux measurements of mouse ATMs revealed unique metabolic rewiring in obesity characterised by both increased glycolysis and oxidative phosphorylation. Similar metabolic activation of CD14+ cells in obese individuals was associated with diabetes outcome. These changes were not observed in peritoneal macrophages from obese vs lean mice and did not resemble metabolic rewiring in M1-primed macrophages. Instead, metabolic activation of macrophages was dose-dependently induced by a set of adipose tissue-derived factors that could not be reduced to leptin or lactate. Using metabolic inhibitors, we identified various metabolic routes, including fatty acid oxidation, glycolysis and glutaminolysis, that contributed to cytokine release by ATMs in lean adipose tissue. Glycolysis appeared to be the main contributor to the proinflammatory trait of macrophages in obese adipose tissue. HIF-1α, a key regulator of glycolysis, nonetheless appeared to play no critical role in proinflammatory activation of ATMs during early stages of obesity.

Conclusions/interpretation: Our results reveal unique metabolic activation of ATMs in obesity that promotes inflammatory cytokine release. Further understanding of metabolic programming in ATMs will most likely lead to novel therapeutic targets to curtail inflammatory responses in obesity.

Data availability: Microarray data of ATMs isolated from obese or lean mice have been submitted to the Gene Expression Omnibus (accession no. GSE84000).

Keywords: Adipose tissue; Glycolysis obesity; Immunometabolism; Inflammation; Macrophages; Oxidative phosphorylation.


Conflict of interest statement

The authors declare that there is no duality of interest associated with this manuscript.

Figures

Fig. 1
Fig. 1
Unique metabolic and inflammatory activation in ATMs during obesity. (a) PCA of various tissue macrophages, separated based on their transcriptome. n = 2 for macrophages from peritoneum, small intestine and adipose tissue; n = 1 for other macrophages. Data are derived from GEO accession no. GSE53986. Percentage of explained variance (expl. var.) is shown. (bd) PCA plot of ATMs from obese (HFD-fed) vs lean (LFD-fed) mice (four pools of 4–7 HFD- or LFD-fed mice), separated based on the complete transcriptome (b) or on expression levels of inflammatory genes (c) or metabolic genes (d). (e, f) Heat maps reflecting expression levels of the top 15 most differentially higher (red) or lower (blue) expressed genes involved in glycolysis (e) or OXPHOS (f) in ATMs from obese vs lean mice, presented as log2 ratio difference (SLR). (g) Expression levels of metabolic genes in peritoneal macrophages and ATMs. The 2ΔΔCtmethod was used to determine fold change inductions normalised to 36b4. Diet-induced changes in expression levels (HFD vs LFD) were tested for significance. (h, i) Lactate production over 24 h by ATMs (h) or peritoneal macrophages (i) from lean (LFD) or obese (HFD) mice. Peritoneal macrophages: n = 7 (LFD, white bars) vs n = 6 (HFD, light grey bars) were used for qRT-PCRs and lactate measurements (g, i). ATMs: four pools (LFD, dark grey bars) vs six pools (HFD, black bars) of 4–7 mice were used for qRT-PCR (g) and a pool of 9 LFD-fed mice vs a pool of 5 HFD-fed mice was used for lactate measurements (n = 3) (h). Data are presented as means ± SEM. *p < 0.05, **p < 0.01 and ***p < 0.001, as shown by brackets, or for obese vs lean mice in (e, f)
Fig. 2
Fig. 2
Metabolic and inflammatory activation of macrophages in obese adipose tissue is distinct from classical activation by LPS and associates with the presence of type 2 diabetes in obese humans. (a) Enriched or depleted (p < 0.01) KEGG-derived gene sets in ATMs of obese (HFD; n = 4 pools) vs lean (LFD; n = 4 pools) mice. (b, d) Regulation of these enriched or depleted gene sets in LPS-activated (n = 4) vs untreated BMDMs (n = 4) (b) or in CD14+ cells from obese diabetic (n = 6) vs obese non-diabetic individuals (n = 6) (d). Data presented in (b) are derived from GEO accession no. GSE53986 and in (d) from GSE54350. (c) Heat map showing expression of genes involved in inflammation in ATMs from obese vs lean mice presented as log2 ratio (SLR) difference with red representing upregulation and blue representing downregulation in ATMs of HFD- vs LFD-fed mice; *p < 0.05, **p < 0.01 and ***p < 0.001 for obese vs lean mice
Fig. 3
Fig. 3
Functional consequences of metabolic activation in ATMs during obesity. (a, b) Basal OCR (a) or ECAR (b) of freshly isolated ATMs from obese (HFD) or lean (LFD) mice. (ce) IL-6 (c), KC (d) or TNF-α (e) secretion over 24 h by ATMs from HFD- or LFD-fed mice. The ATMs (n ≥ 3) were plated from a pool of nine (LFD) or five (HFD) mice. Data are presented as means (c, d, e) ± SEM (a, b). *p < 0.05, **p < 0.01 and ***p < 0.001
Fig. 4
Fig. 4
Dose-dependent adipose tissue-induced activation of macrophages ex vivo. (a, b) Basal OCR (a) and ECAR (b) of BMDMs co-cultured (co AT) with 100 mg of obese (Ob) or lean (Le) adipose tissue for 3 days. (ce) Secretion of IL-6 (c), KC (d) or TNF-α (e) by BMDMs exposed to lean or obese adipose tissue (AT), or activated by LPS (M1) or IL-4 (M2). Effects of diet (obese vs lean) and dose of adipose tissue (25 mg vs 100 mg) were tested for significance. n ≥ 3 for all experiments. Data are presented as means (c, d, e) ± SEM (a, b); *p < 0.05, **p < 0.01
Fig. 5
Fig. 5
Glycolysis largely controls cytokine release by ATMs during obesity. Secretion of IL-6 (a), KC (b), TNF-α (c) or lactate (d) by ATMs isolated from lean (grey circles) or obese (black circles) mice. Cytokines were measured basally (Ctrl) or upon stimulation of ATMs with various metabolic inhibitors for 24 h. Effects of diet (obese vs lean) and treatment (metabolic inhibitors vs control) were tested for significance. Secretion of TNF-α by ATMs from obese mice tended to be reduced upon treatment with 2-DG (p = 0.06). ATMs (n = 3) were plated from a pool of 9 LFD-fed mice and 5 HFD-fed mice. Data are presented as means; *p < 0.05, **p < 0.01 and ***p < 0.001 for indicated comparisons (vs Ctrl obese or lean as shown) or for obese vs lean within each treatment
Fig. 6
Fig. 6
Myeloid-specific absence of HIF-1α does not affect adipose tissue inflammation in HFD-fed mice. (a) Fold change expression of Hif-1α and its target genes in BMDMs held in L929-conditioned medium (white bars) or exposed to 100 mg lean adipose tissue explant (grey bars) or obese adipose tissue explant (black bars) for 3 days. Starting quantities were used for normalisation against 36b4. (b, c) IL-6 production by epidydimal adipose tissue isolated from LysM Hif-1α+/+ (+/+) or LysM Hif-1α−/− (−/−) mice, either unstimulated (b) or stimulated with 10 ng/ml LPS for 24 h (c). (d) Glucose measured in plasma of LysM Hif-1α+/+ (white circles) or LysM Hif-1α−/− (black circles) mice upon the injection of insulin at 0 min. (e) Total Akt (t-Akt) and p-Akt protein levels in epidydimal adipose tissue from LysM Hif-1α+/+ or LysM Hif-1α−/− mice unstimulated (−) or stimulated with insulin (+) for 20 min. (f) SRC as percentage increase from basal OCR in BMDMs in 5% (vol./vol.) L929 (Ctrl) or upon 3 days of co-culture (co AT) with 100 mg adipose tissue isolated from lean (Le) or obese (Ob) mice. (g) SRC as percentage increase from basal OCR in BMDMs isolated from LysM Hif-1α+/+ (+/+) or LysM Hif-1α−/− (−/−) mice. (h) Lactate secretion over 24 h by BMDMs isolated from LysM Hif-1α+/+ (+/+) or LysM Hif-1α−/− (−/−) mice. (i, j) Basal ECAR (i) and OCR (j) in BMDMs from LysM Hif-1α+/+ (+/+) or LysM Hif-1α−/− (−/−) mice. Basal ECAR were lower in BMDMs of LysM Hif-1α−/− vs LysM Hif-1α+/+ mice (although the difference did not reach statistical significance, p < 0.051). For the in vivo study, n = 8 animals per genotype/diet were included. n = 3 for all in vitro experiments. Data are presented as means ± SEM. *p < 0.05, **p < 0.01 and ***p < 0.001

References

    1. Bigornia SJ, Farb MG, Mott MM, et al. Relation of depot-specific adipose inflammation to insulin resistance in human obesity. Nutr Diabetes. 2012;2:e30. doi: 10.1038/nutd.2012.3. - DOI - PMC - PubMed
    1. Lumeng CN, Deyoung SM, Bodzin JL, Saltiel AR. Increased inflammatory properties of adipose tissue macrophages recruited during diet-induced obesity. Diabetes. 2007;56:16–23. doi: 10.2337/db06-1076. - DOI - PubMed
    1. Wentworth JM, Naselli G, Brown WA, et al. Pro-inflammatory CD11c+CD206+ adipose tissue macrophages are associated with insulin resistance in human obesity. Diabetes. 2010;59:1648–1656. doi: 10.2337/db09-0287. - DOI - PMC - PubMed
    1. Gordon S. Alternative activation of macrophages. Nat Rev Immunol. 2003;3:23–35. doi: 10.1038/nri978. - DOI - PubMed
    1. Mills CD, Kincaid K, Alt JM, Heilman MJ, Hill AM. M-1/M-2 macrophages and the Th1/Th2 paradigm. J Immunol. 2000;164:6166–6173. doi: 10.4049/jimmunol.164.12.6166. - DOI - PubMed

Publication types