. 2018 Apr;175(7):1066-1084.
doi: 10.1111/bph.14144. Epub 2018 Feb 13.

Adiponectin inhibits inflammatory cytokines production by Beclin-1 phosphorylation and B-cell lymphoma 2 mRNA destabilization: role for autophagy induction

Affiliations

Adiponectin inhibits inflammatory cytokines production by Beclin-1 phosphorylation and B-cell lymphoma 2 mRNA destabilization: role for autophagy induction

Nirmala Tilija Pun et al. Br J Pharmacol. 2018 Apr.

Abstract

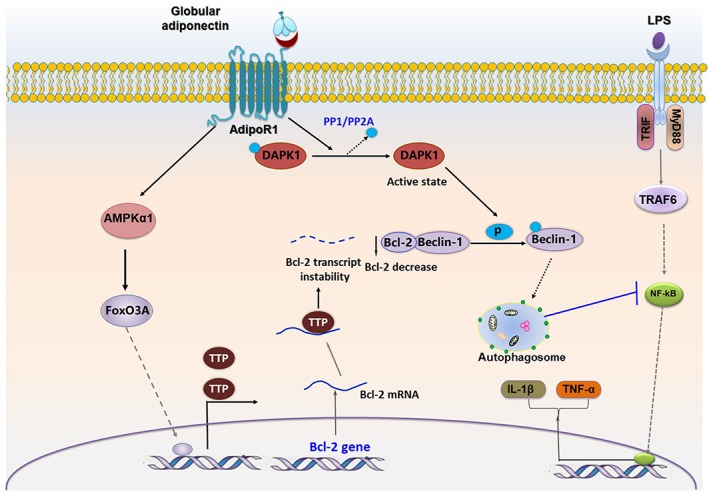
Background and purpose: Adiponectin potently suppresses inflammatory mediator production. Autophagy is known to play a critical role in the modulation of inflammatory responses by adiponectin. However, the underlying mechanisms are not clearly understood. Interaction between Beclin-1 and B-cell lymphoma 2 (Bcl-2) is a critical event in autophagy induction. We examined the effects of globular adiponectin (gAcrp) on the Beclin-1/Bcl-2 association and its underlying mechanisms.

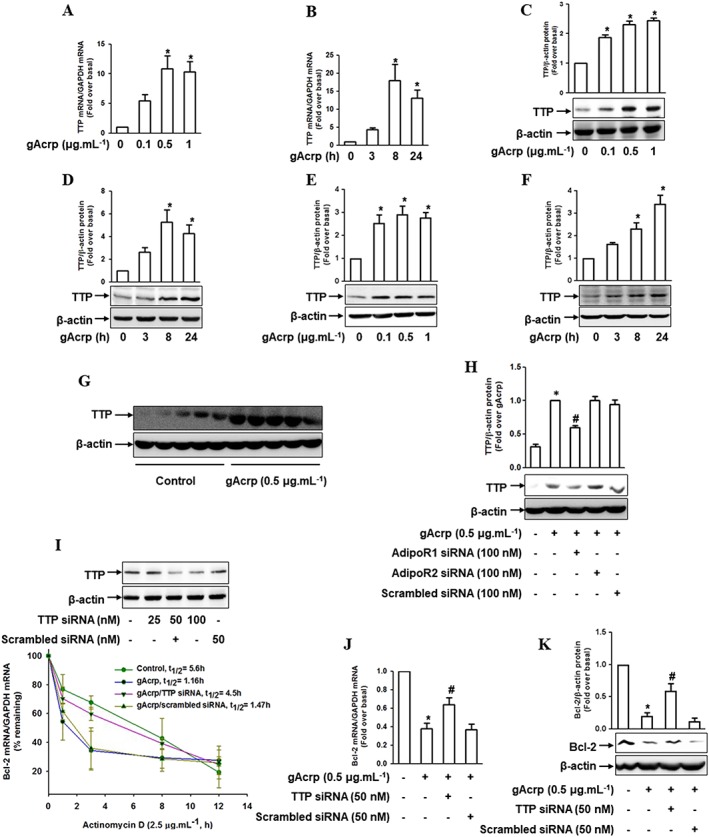
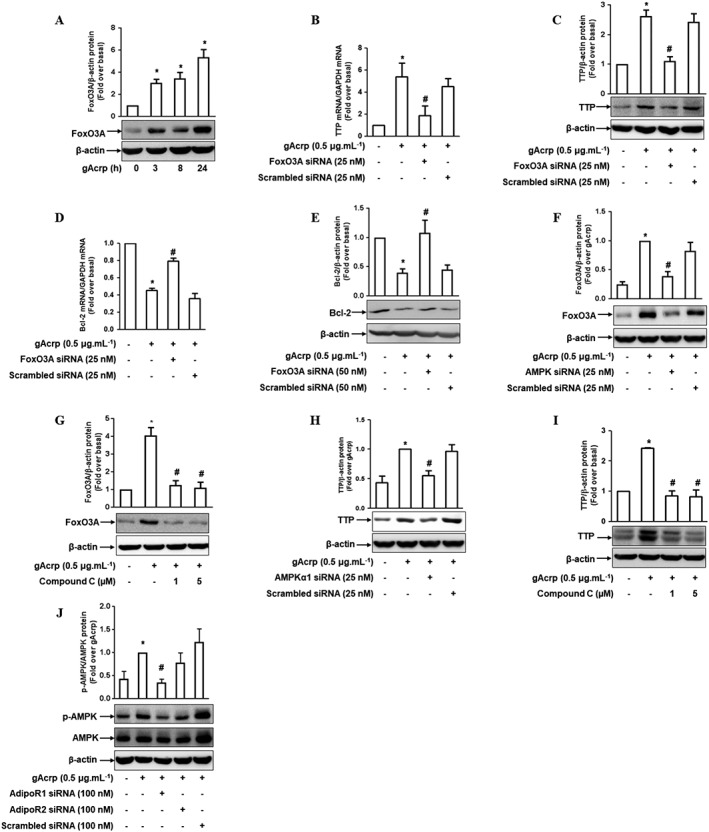
Experimental approach: The effect of gAcrp on the interaction between Beclin-1 and Bcl-2 was examined by immunoprecipitation followed by Western blotting. To elucidate the underlying mechanisms, we determined the effects of gAcrp on Beclin-1 phosphorylation and Bcl-2 mRNA stability, and investigated their role in the suppression of inflammatory mediators using pharmacological inhibitors and transient target gene knockdown.

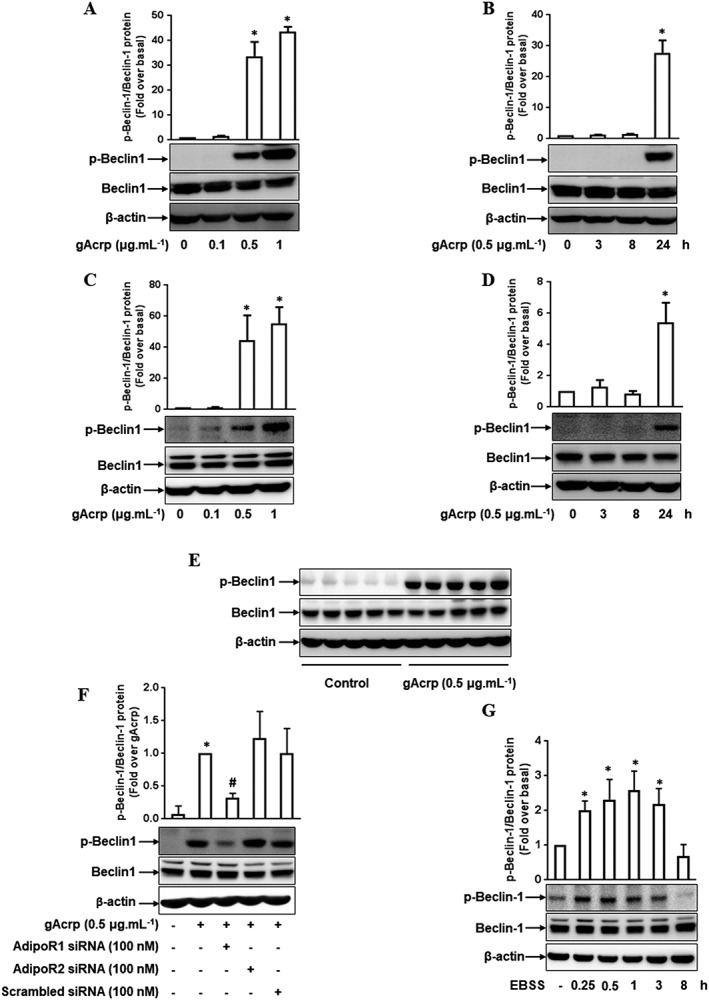
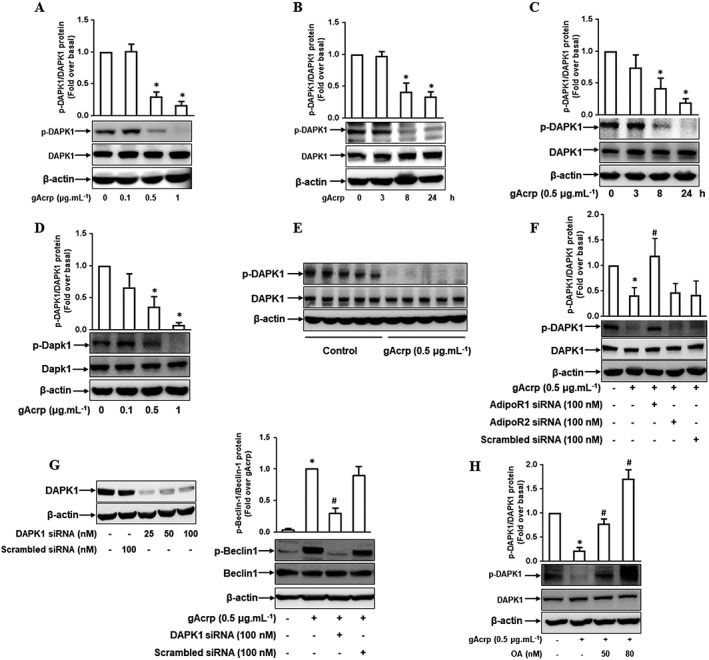
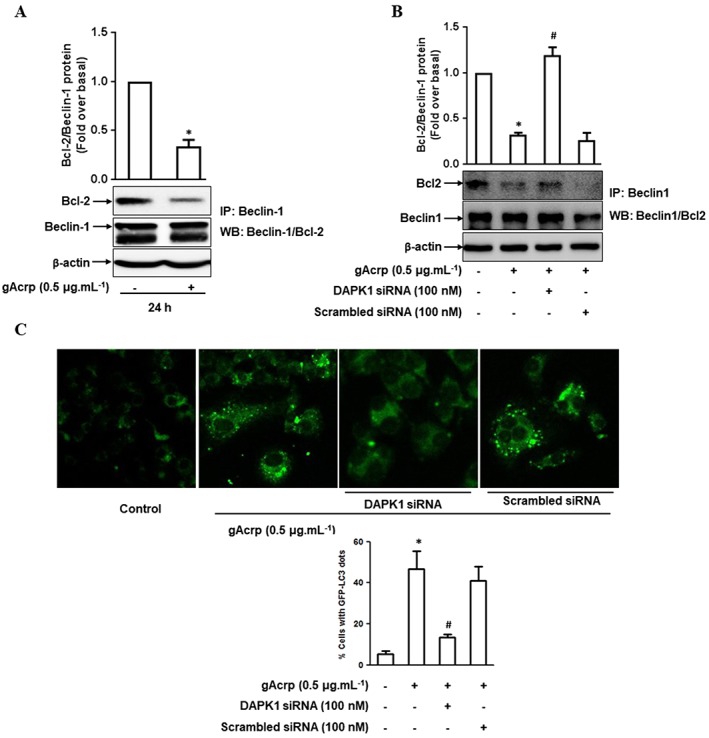
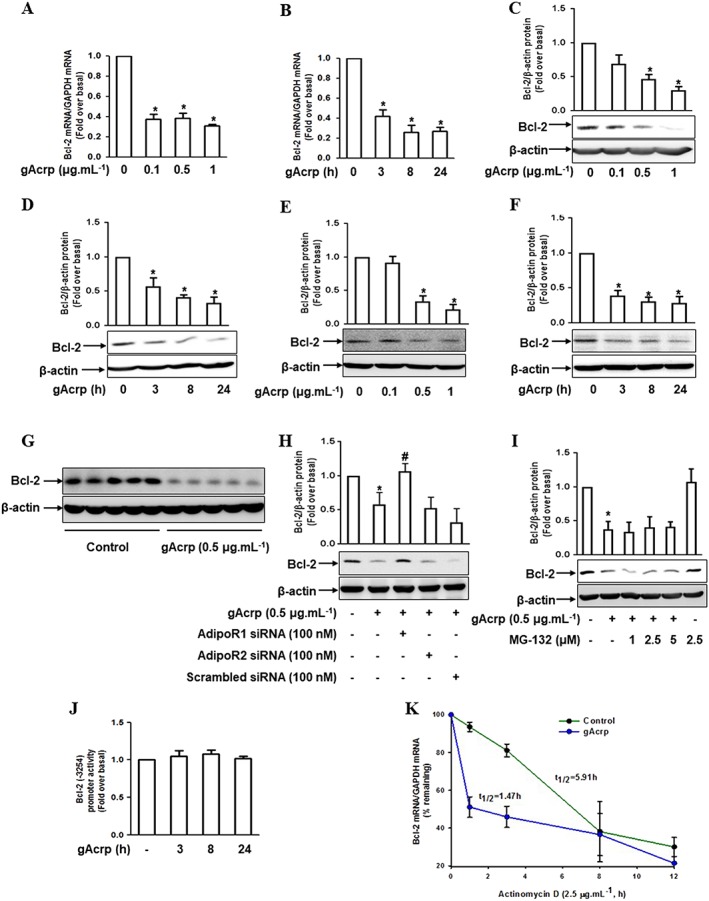
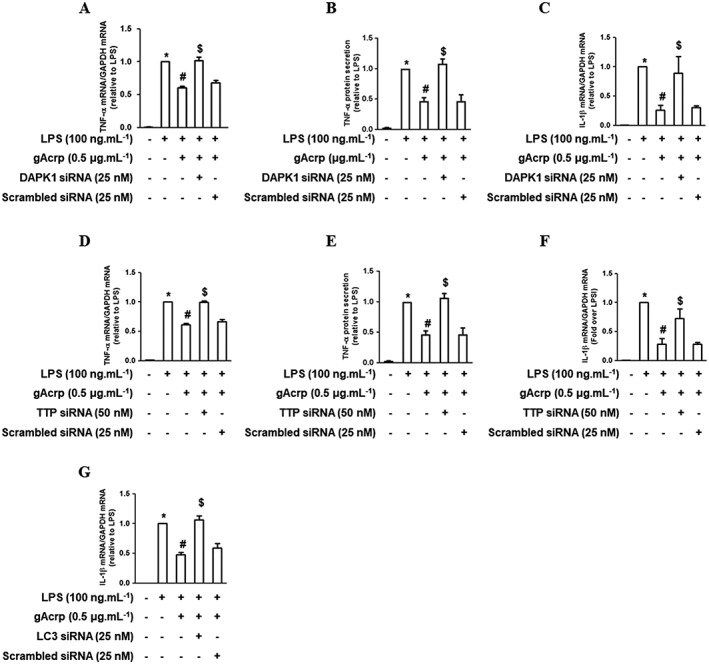
Key results: Globular adiponectin disrupted the association between Beclin-1 and Bcl-2 and increased Beclin-1 phosphorylation at Thr119 , critical residue for binding with Bcl-2, via a death-associated protein kinase-1 (DAPK1)-dependent mechanism. Moreover, gAcrp reduced Bcl-2 expression via Bcl-2 mRNA destabilization, without significantly affecting Bcl-2 promoter activity and protein degradation, which was mediated by tristetraprolin (TTP) induction. Finally, DAPK1 and TTP were shown to play key roles in gAcrp-induced autophagosome formation and suppression of LPS-stimulated TNF-α and IL-1β expression.

Conclusion and implications: Beclin-1 phosphorylation and Bcl-2 mRNA destabilization mediated by DAPK1 and TTP are crucial events leading to autophagy and the suppression of inflammatory cytokine production by gAcrp. These results provide novel mechanisms underlying adiponectin's modulation of inflammatory responses. DAPK and TTP are potential therapeutic targets for the management of inflammation.


Figures

Figure 1
Figure 1
Effect of gAcrp on Beclin‐1 phosphorylation at Thr119 in macrophages. (A, B) RAW 264.7 macrophages were stimulated with the indicated concentrations of gAcrp for 24 h (A) or with 0.5 μg·mL−1 of gAcrp for different periods (B). Total and phosphorylated levels of Beclin‐1 were measured by Western blot analysis. (C, D) Macrophages isolated from murine peritoneum were stimulated with different concentrations of gAcrp for 24 h (C) or with gAcrp (0.5 μg·mL−1) for different durations (D). Total and phosphorylated Beclin‐1 levels were detected by Western blot analysis. (E) Mice were injected i.p. with gAcrp. After 24 h, peritoneal macrophages were isolated, and total and phosphorylated levels of Beclin‐1 were measured by Western blot analysis. (F) RAW 264.7 macrophages were transfected either with Adipo1, Adipo2 receptors or scrambled siRNA. After 24 h, the cells were treated with gAcrp for an additional 24 h. Expression of phosphorylated Beclin‐1 protein was measured by Western blot analysis. (G) RAW 264.7 macrophages were incubated in starvation EBSS media for the indicated times, and the expression levels of total and phosphorylated Beclin‐1 were determined by Western blot analysis. Throughout the Western blot analysis, the phosphorylated level of Beclin‐1 was quantified by densitometric analysis. The expression level of phospho‐Beclin‐1 was normalized to the level of total Beclin‐1 (used as an internal loading control) and shown in the upper panel of each Western blot image. Values represent the fold change relative to control (fold over basal) and are presented as mean ± SEM (n = 5). *P < 0.05 as compared to control cells and # P < 0.05 as compared to gAcrp treatment.
Figure 2
Figure 2
Effect of gAcrp on DAPK1 activation in macrophages and its role in Beclin‐1 phosphorylation in macrophages. (A, B) RAW 264.7 macrophages were stimulated with different doses of gAcrp for 24 h (A) or with 0.5 μg·mL−1 of gAcrp for the indicated periods (B). Protein expression levels of total and phosphorylated DAPK1 were determined by Western blot analysis. (C, D) Murine peritoneal macrophages were stimulated with the indicated doses of gAcrp for 24 h (C) or with 0.5 μg·mL−1 of gAcrp for the designated times (D). Total and phosphorylated DAPK1 levels were measured by Western blot analysis. (E) After 24 h injection with gAcrp, macrophages were isolated from murine peritoneum. Total and phosphorylated levels of DAPK1 were measured by Western blot analysis. (F) RAW 264.7 macrophages were transfected with siRNA targeting Adipo1, Adipo2 receptors or scrambled siRNA. After 24 h incubation, the cells were stimulated with gAcrp for 24 h. Total and phosphorylated levels of DAPK1 were measured by Western blot analysis. (G) RAW 264.7 macrophages were transfected either with DAPK1 siRNA or control scrambled siRNA for 24 h, followed by stimulation with gAcrp for 24 h. The gene silencing efficiency of DAPK1 siRNA was monitored by Western blot analysis (left panel). Total and phosphorylated Beclin‐1 levels were detected by Western blot analysis (right panel). (H) RAW 264.7 macrophages were initially stimulated with the indicated concentrations of okadaic acid (OA) for 1 h, followed by treatment with gAcrp for an additional 24 h. Total and phosphorylated DAPK1 levels were determined by Western blot analysis. Representative images from at least five sets of independent experiments are shown for all the Western blot analyses. Phosphorylated DAPK1 and Beclin‐1 expression levels were quantified by densitometric analysis and are shown above each Western blot image. Values are presented as the fold change relative to control group (fold over basal) and are expressed as mean ± SEM (n = 5). *P < 0.05 as compared with control cells. # P < 0.05 as compared with the cells treated with gAcrp.
Figure 3
Figure 3
Role of DAPK1 signalling in the modulation of Beclin‐1 and Bcl‐2 protein interaction and autophagosome formation by gAcrp in macrophages. (A, B) RAW 264.7 macrophages were treated with gAcrp (0.5 μg·mL−1) for 24 h (A), or cells were transfected with DAPK1 siRNA or scrambled control siRNA for 24 h, followed by stimulation with gAcrp for an additional 24 h (B). The physical interaction between Beclin‐1 and Bcl‐2 was measured by immunoprecipitation using anti‐Beclin‐1 antibody and further immuno‐blotting with anti‐Bcl‐2 or anti‐Beclin‐1 antibody, as described in the Methods section. The representative images from independent experiments are shown. Data from densitometric analysis for the measurement of Bcl‐2 protein are presented above each Western blot image. (C) After transfection with DAPK1 siRNA or with scrambled control siRNA for 24 h, RAW 264.7 macrophages were further co‐transfected with eGFP‐tagged LC3 plasmids (eGFP‐LC3) followed by treatment with gAcrp for an additional 24 h. The cells were then fixed with paraformaldehyde solution and the formation of autophagosomes was indicated by the presence of LC3 dots (green dots) in the cytosol, as captured using an A1 Confocal Laser Microscope. Representative images from five sets of independent experiments are shown along with the quantification of LC3 dots in the lower panel. In (A), (B) and (C), the values are shown as the fold increases relative to the control (fold over basal) and are indicated as mean ± SEM (n = 5). *P < 0.05 as compared to control and # P < 0.05 as compared to the cells treated with gAcrp.
Figure 4
Figure 4
Effect of gAcrp on Bcl‐2 mRNA stability in macrophages. (A, B) RAW 264.7 macrophages were stimulated with different doses of gAcrp for 24 h (A) or with 0.5 μg·mL−1 of gAcrp for designated periods (B). The expression levels of Bcl‐2 mRNA were measured by qRT‐PCR analysis as indicated in the Methods section. (C, D) Cells were stimulated with different concentrations of gAcrp for 24 h (C) or with 0.5 μg·mL−1 of gAcrp for the indicated periods (D). The expression levels of Bcl‐2 protein were determined by Western blot analysis. (E, F) Macrophages isolated from murine peritoneum were stimulated with different concentrations of gAcrp for 24 h (E) or with 0.5 μg·mL−1 of gAcrp for the indicated times (F). The expression levels of Bcl‐2 protein were measured by Western blot analysis. (G) Mice were injected i.p. with gAcrp. After 24 h, peritoneal macrophages were isolated, and Bcl2 expression levels were measured by Western blot analysis. (H) RAW 264.7 macrophages were transfected with siRNA targeting Adipo1 or Adipo2 receptors, or scrambled siRNA. Cells were then further treated with gAcrp for 24 h and Bcl‐2 protein expression was measured by Western blot analysis. (I) RAW 264.7 macrophages were pretreated with the indicated concentrations of MG‐132 for 1 h, followed by gAcrp (0.5 μg·mL−1) for an additional 24 h. Bcl‐2 protein levels were measured by Western blot analysis. Expression levels of Bcl‐2 were quantified by densitometric analysis and the data are presented above each Western blot image. (J) RAW 264.7 macrophages were transfected with Bcl‐2 promoter plasmids tagged with luciferase using FuGENE HD transfection reagent, and the cells were stimulated with gAcrp for different time points. The luciferase activity (indicative of Bcl‐2 promoter activity) was measured by a luciferase assay. (K) Cells were pre‐stimulated with gAcrp for 24 h and then further treated with actinomycin D (2.5 μg·mL−1) for the indicated time periods. The levels of Bcl‐2 mRNA were measured by qPCR, and the half‐life (t 1/2) of Bcl‐2 mRNA was calculated as the percentage remaining by measuring the levels of Bcl‐2 mRNA. Values represent fold change relative to the control cells and are presented as mean ± SEM (n = 5). *P < 0.05 as compared with control cells and # P < 0.05 as compared to cells treated with gAcrp.
Figure 5
Figure 5
Effect of gAcrp on TTP induction and the role of TTP in Bcl‐2‐mRNA destabilization by gAcrp in macrophages. (A, B) RAW 264.7 macrophages were stimulated with the indicated concentrations of gAcrp for 24 h (A) or with 0.5 μg·mL−1 of gAcrp for the indicated time points (B). The TTP mRNA levels were measured by qRT‐PCR analysis. (C, D) Cells were stimulated with different concentrations of gAcrp for 24 h (C) or with gAcrp (0.5 μg·mL−1) for the indicated periods (D). TTP protein levels were determined by Western blot analysis along with β‐actin as an internal loading control. (E, F) Murine peritoneal macrophages were stimulated with different concentrations of gAcrp for 24 h (E) or with 0.5 μg·mL−1 of gAcrp for the indicated times (F). TTP protein expression levels were measured by Western blot analysis along with β‐actin as an internal loading control. (G) Peritoneal macrophages were isolated from mice injected with gAcrp (1.5 μg.g−1 wt. of mouse), and TTP protein expression was measured by Western blot analysis. (H) RAW 264.7 macrophages were transfected with Adipo1, Adipo2 receptors’ or scrambled siRNA. After 24 h of transfection, cells were treated with gAcrp for an additional 24 h. TTP protein expression was measured by Western blot analyses. (I) RAW 264.7 macrophages were transfected with siRNA targeting TTP or with scrambled control siRNA for 24 h. The gene silencing efficiency of TTP was monitored by Western blot analysis (upper panel). After transfection with TTP siRNA, the cells were pretreated with gAcrp for 24 h and then further treated with actinomycin D (2.5 μg·mL−1) for up to 12 h. Bcl‐2 mRNA levels were measured by qPCR, and the half‐life was calculated as the percentage remaining by measuring the levels of Bcl‐2 mRNA (lower panel). (J, K) RAW 264.7 macrophages were transfected with TTP siRNA or with scrambled control siRNA for 24 h. The cells were then treated with gAcrp for 24 h. Bcl‐2 mRNA (J) and protein (K) levels were determined by qRT‐PCR and Western blot analysis respectively. In all the Western blot analyses, the representative images from at least five independent experiments are shown. Quantitative analyses of proteins were performed by densitometric analysis and the data are shown above the images. The values are expressed as mean ± SEM (n = 5). *P < 0.05 as compared with the control cells and # P < 0.05 as compared with the cells treated with gAcrp.
Figure 6
Figure 6
The crucial role of AMPK and FoxO3A in TTP induction by gAcrp in RAW 264.7 macrophages. (A) The cells were treated with gAcrp (0.5 μg·mL−1) for the indicated periods and the total FoxO3A protein level was determined by Western blot analysis along with β‐actin as an internal loading control. (B, C) The cells were transfected with siRNA targeting FoxO3A gene and further stimulated with gAcrp for an additional 6 h. The levels of TTP mRNA (B) and protein (C) were determined by qRT‐PCR and Western blot analysis respectively. (D, E) After transfection with FoxO3A siRNA, the cells were treated with gAcrp for 24 h. The expression levels of Bcl‐2 mRNA (D) and protein (E) were measured by qRT‐PCR and Western blot analysis respectively. (F) Cells were transfected with siRNA targeting AMPKα1, followed by treatment with gAcrp for an additional 6 h. The total FoxO3A protein level was determined by Western blot analysis. (G) The cells were pretreated with the indicated concentrations of compound C for 2 h, followed by stimulation with gAcrp for an additional 6 h. The FoxO3A protein expression level was determined by Western blot analysis. (H) After transfection with siRNA targeting AMPKα1, the cells were treated with gAcrp for 6 h. The TTP protein expression level was determined by Western blot analysis. (I) Cells were pretreated with compound C for 2 h, followed by further stimulation with gAcrp for an additional 6 h. TTP protein expression was measured by Western blot analysis. (J) RAW 264.7 macrophages were transfected with Adipo1, Adipo2 receptors’ or scrambled siRNA. Cells were then further treated with gAcrp for 24 h. Phospho‐ and total AMPK protein expression were measured by Western blot analysis. The representative images from five independent sets of experiments are shown in all Western blots. Quantitative analyses of FoxO3A, TTP, Bcl‐2 and p‐AMPKα1 protein expression bands were performed by densitometric analysis, and the results are presented above each Western blotting image. Values are presented as mean ± SEM (n = 5). *P < 0.05 compared with the control cells and # P < 0.05 compared with the cells treated with gAcrp.
Figure 7
Figure 7
Role of DAPK1 and TTP signalling in the suppression of LPS‐induced cytokine expression by gAcrp in macrophages. (A, B) After transfection with siRNA targeting DAPK1, cells were treated with gAcrp for 24 h, followed by LPS treatment for an additional 2 h (A) or 4 h (B). (A) TNF‐α mRNA levels were determined by qRT‐PCR. (B) Cell culture media were collected and the secreted amount of TNF‐α was measured by elisa. (C) After DAPK1 gene silencing and gAcrp treatment as indicated, the cells were further stimulated with LPS for an additional 6 h. The IL‐1β mRNA expression level was determined by qRT‐PCR. (D–F) After transfection with siRNA targeting TTP, the cells were treated with gAcrp for 24 h and LPS for 2 h (D), 4 h (E) or 6 h (F). (D) The TNF‐α mRNA level was determined by qRT‐PCR. (E) The secretion of TNF‐α protein was measured by elisa. (F) The IL‐β mRNA level was determined by qRT‐PCR. (G) Cells were transfected either with LC3B siRNA or scrambled siRNA. The cells were then treated with gAcrp for 18 h, followed by incubation with LPS for an additional 6 h. The expression of IL‐1β mRNA was detected by qRT‐PCR. Values are expressed as mean ± SEM (n = 5). *P < 0.05 compared with the control cells. # P < 0.05 compared with the cells treated with LPS. $ P < 0.05 compared with the cells treated with LPS and gAcrp together.
Figure 8
Figure 8
Proposed model for the role of DAPK1‐mediated Beclin‐1 phosphorylation and TTP‐mediated Bcl‐2 mRNA destabilization in autophagy leading to the suppression of inflammatory responses by gAcrp in macrophages. Bcl‐2 protein binds to Beclin‐1 through its BH3 domain. The activation of DAPK1 by gAcrp facilitates Beclin‐1 phosphorylation at Thr119 and inhibits binding to its inhibitory protein Bcl‐2, which leads to autophagosome formation. For the other way, the level of Bcl‐2 protein itself is reduced by gAcrp through TTP‐mediated mRNA instability. AMPKα1/FoxO3A axis signalling acts as an upstream pathway that leads to the induction of TTP protein. The Adipo1 receptor (AdipoR1), rather than the Adipo2 receptor, plays a predominant role in the modulation of DAPK/Beclin‐1 signalling and AMPK/FoxO3A/TTP/Bcl2 axis by gAcrp in macrophages. Both DAPK1 activation and TTP induction are involved in autophagy activation via the modulation of Beclin‐1 and Bcl‐2 protein interaction, which inhibits LPS‐primed inflammatory cytokines expression

Similar articles

Cited by

References

    1. Abrahamsen H, Stenmark H, Platta HW (2012). Ubiquitination and phosphorylation of Beclin 1 and its binding partners: tuning class III phosphatidylinositol 3‐kinase activity and tumor suppression. FEBS Lett 586: 1584–1591. - PubMed
    1. Achari AE, Jain SK (2017). Adiponectin, a therapeutic target for obesity, diabetes, and endothelial dysfunction. Int J Mol Sci 18: 1321. - PMC - PubMed
    1. Alexander SPH, Kelly E, Marrion NV, Peters JA, Faccenda E, Harding SD et al (2017a). The Concise Guide to PHARMACOLOGY 2017/18: Overview. Br J Pharmacol 174: S1–S16. - PMC - PubMed
    1. Alexander SPH, Fabbro D, Kelly E, Marrion NV, Peters JA, Faccenda E et al (2017b). The Concise Guide to PHARMACOLOGY 2017/18: Enzymes. Br J Pharmacol 174: S272–S359. - PMC - PubMed
    1. Azad N, Iyer AK, Manosroi A, Wang L, Rojanasakul Y (2008). Superoxide‐mediated proteasomal degradation of Bcl‐2 determines cell susceptibility to Cr(VI)‐induced apoptosis. Carcinogenesis 29: 1538–1545. - PMC - PubMed

Publication types