

The effect of risk factor misclassification on the partial population attributable risk
- PMID: 29333614
- PMCID: PMC6003717
- DOI: 10.1002/sim.7559
The effect of risk factor misclassification on the partial population attributable risk
Abstract
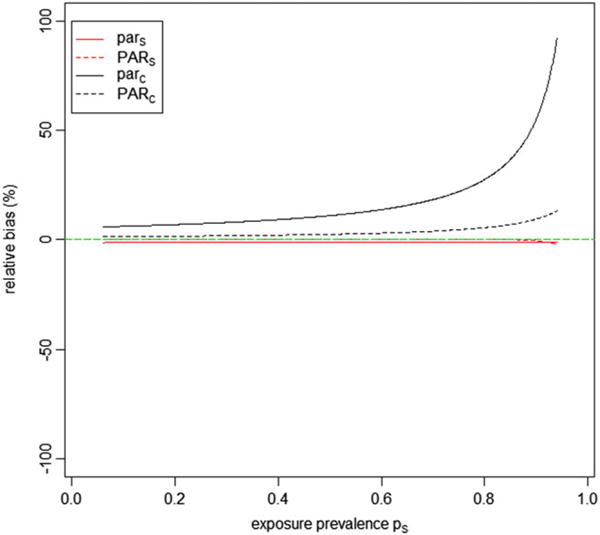
The partial population attributable risk (pPAR) is used to quantify the population-level impact of preventive interventions in a multifactorial disease setting. In this paper, we consider the effect of nondifferential risk factor misclassification on the direction and magnitude of bias of pPAR estimands and related quantities. We found that the bias in the uncorrected pPAR depends nonlinearly and nonmonotonically on the sensitivities, specificities, relative risks, and joint prevalence of the exposure of interest and background risk factors, as well as the associations between these factors. The bias in the uncorrected pPAR is most dependent on the sensitivity of the exposure. The magnitude of bias varies over a large range, and in a small region of the parameter space determining the pPAR, the direction of bias is away from the null. In contrast, the crude PAR can only be unbiased or biased towards the null by risk factor misclassification. The semiadjusted PAR is calculated using the formula for the crude PAR but plugs in the multivariate-adjusted relative risk. Because the crude and semiadjusted PARs continue to be used in public health research, we also investigated the magnitude and direction of the bias that may arise when using these formulae instead of the pPAR. These PAR estimators and their uncorrected counterparts were calculated in a study of risk factors for colorectal cancer in the Health Professionals Follow-up Study, where it was found that because of misclassification, the pPAR for low folate intake was overestimated with a relative bias of 48%, when red meat and alcohol intake were treated as misclassified risk factors that are not modified, and when red meat was treated as the modifiable risk factor, the estimated value of the pPAR went from 14% to 60%, further illustrating the extent to which misclassification can bias estimates of the pPAR.
Keywords: attributable risk; bias; measurement error; risk factor misclassification.
Copyright © 2018 John Wiley & Sons, Ltd.
Figures


Similar articles
-
Estimation and inference for the population attributable risk in the presence of misclassification.Biostatistics. 2021 Oct 13;22(4):805-818. doi: 10.1093/biostatistics/kxz067. Biostatistics. 2021. PMID: 32112073 Free PMC article.
-
Implications of nondifferential misclassification on estimates of attributable risk.Methods Inf Med. 2002;41(4):342-8. Methods Inf Med. 2002. PMID: 12425247
-
Differential misclassification arising from nondifferential errors in exposure measurement.Am J Epidemiol. 1991 Nov 15;134(10):1233-44. doi: 10.1093/oxfordjournals.aje.a116026. Am J Epidemiol. 1991. PMID: 1746532
-
Methodological issues regarding confounding and exposure misclassification in epidemiological studies of occupational exposures.Am J Ind Med. 2007 Mar;50(3):199-207. doi: 10.1002/ajim.20281. Am J Ind Med. 2007. PMID: 17096363 Review.
-
Effects of misclassification on estimates of relative risk in family history studies.Genet Epidemiol. 1999;16(4):368-81. doi: 10.1002/(SICI)1098-2272(1999)16:4<368::AID-GEPI4>3.0.CO;2-A. Genet Epidemiol. 1999. PMID: 10207718 Review.
Cited by
-
Upper-extremity musculoskeletal disorders: how many cases can be prevented? Estimates from the COSALI cohort.Scand J Work Environ Health. 2020 Nov 1;46(6):618-629. doi: 10.5271/sjweh.3911. Epub 2020 Jul 8. Scand J Work Environ Health. 2020. PMID: 32638027 Free PMC article.
-
Preventable incidence of carcinoma associated with adiposity, alcohol and physical inactivity according to smoking status in the United States.Int J Cancer. 2020 Jun 1;146(11):2960-2967. doi: 10.1002/ijc.32602. Epub 2019 Aug 14. Int J Cancer. 2020. PMID: 31369145 Free PMC article.
-
The cost of inaction on physical inactivity to public health-care systems: a population-attributable fraction analysis.Lancet Glob Health. 2023 Jan;11(1):e32-e39. doi: 10.1016/S2214-109X(22)00464-8. Epub 2022 Dec 5. Lancet Glob Health. 2023. PMID: 36480931 Free PMC article.
-
The role of obesity in the risk of gestational diabetes among immigrant and U.S.-born women in New York City.Ann Epidemiol. 2018 Apr;28(4):242-248. doi: 10.1016/j.annepidem.2018.02.006. Epub 2018 Feb 15. Ann Epidemiol. 2018. PMID: 29501220 Free PMC article.
-
Physical inactivity and non-communicable disease burden in low-income, middle-income and high-income countries.Br J Sports Med. 2022 Jan;56(2):101-106. doi: 10.1136/bjsports-2020-103640. Epub 2021 Mar 29. Br J Sports Med. 2022. PMID: 33782046 Free PMC article.
References
-
- Levin ML. The occurrence of lung cancer in man. Acta-Unio Internationalis Contra Cancrum. 1952;9(3):531–541. - PubMed
-
- Rothman KJ, Greenland S. Modern epidemiology. 1998
-
- Mocellin S, Verdi D, Nitti D. DNA repair gene polymorphisms and risk of cutaneous melanoma: a systematic review and meta-analysis. Carcinogenesis. 2009;30(10):1735–1743. - PubMed
-
- Cerhan JR, Potter JD, Gilmore JME, et al. Adherence to the AICR cancer prevention recommendations and subsequent morbidity and mortality in the Iowa Women’s Health Study cohort. Cancer Epidemiol Biomarkers Prev. 2004;13(7):1114–1120. - PubMed
Publication types
MeSH terms
Grants and funding
LinkOut - more resources
Full Text Sources
Other Literature Sources
Miscellaneous