. 2018 Sep;21(5):e12651.
doi: 10.1111/desc.12651. Epub 2018 Jan 14.

Infant brain responses to felt and observed touch of hands and feet: an MEG study

Affiliations

Infant brain responses to felt and observed touch of hands and feet: an MEG study

Andrew N Meltzoff et al. Dev Sci. 2018 Sep.

Abstract

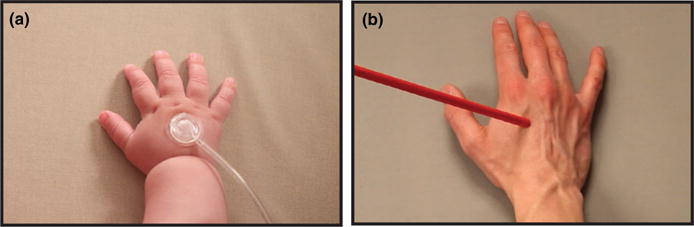
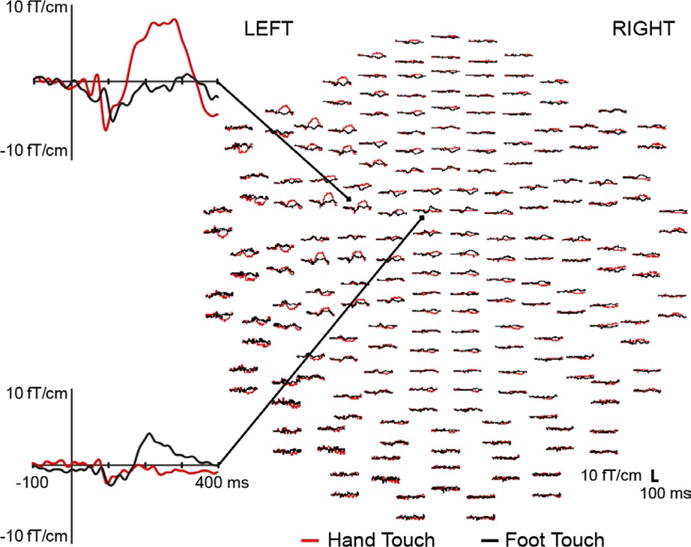
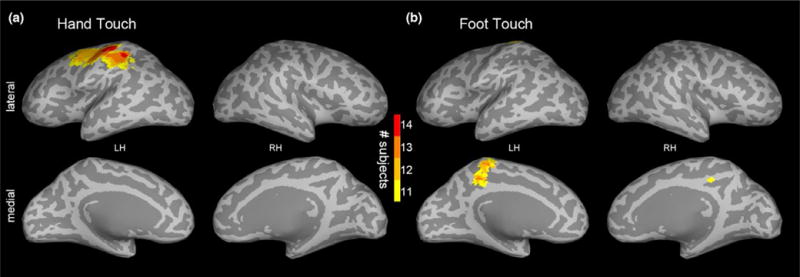
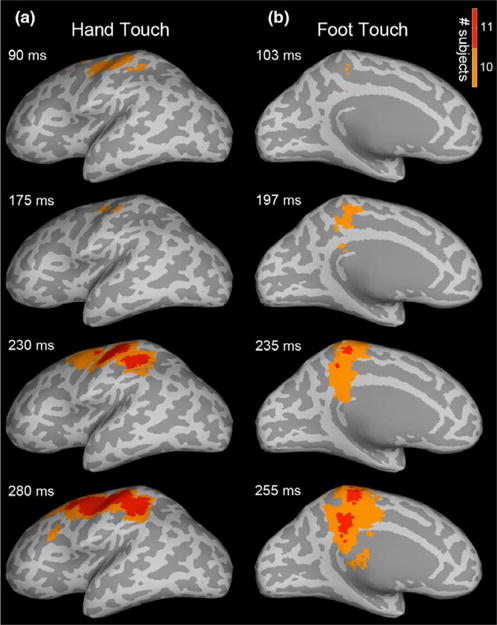
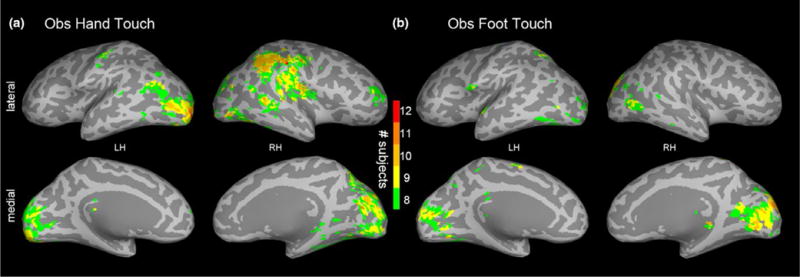
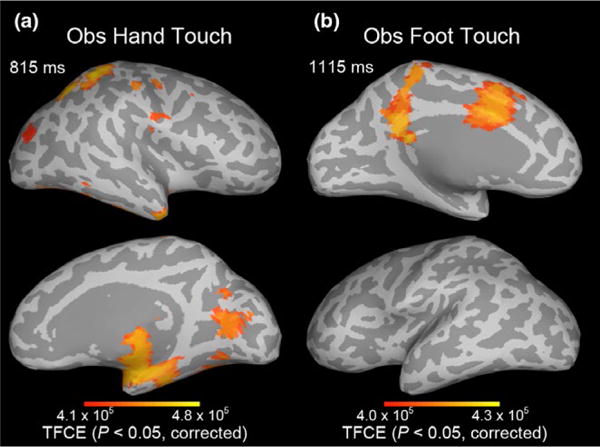
There is growing interest concerning the ways in which the human body, both one's own and that of others, is represented in the developing human brain. In two experiments with 7-month-old infants, we employed advances in infant magnetoencephalography (MEG) brain imaging to address novel questions concerning body representations in early development. Experiment 1 evaluated the spatiotemporal organization of infants' brain responses to being touched. A punctate touch to infants' hands and feet produced significant activation in the hand and foot areas of contralateral primary somatosensory cortex as well as in other parietal and frontal areas. Experiment 2 explored infant brain responses to visually perceiving another person's hand or foot being touched. Results showed significant activation in early visual regions and also in regions thought to be involved in multisensory body and self-other processing. Furthermore, observed touch of the hand and foot activated the infant's own primary somatosensory cortex, although less consistently than felt touch. These findings shed light on aspects of early social cognition, including action imitation, which may build, at least in part, on infant neural representations that map equivalences between the bodies of self and other.


Figures

FIGURE 1
FIGURE 1
Experiment 1 examined infants’ response to felt touch. (a) Example photograph of tactile stimulator used in Experiment 1. Infants were stimulated on the right hand (or foot) by an inflatable diaphragm. Experiment 2 examined infants’ responses to observed touch. (b) Single video frame extracted from the visual stimulus shown to infants in Experiment 2 at the point when the rod contacted the hand. Infants watched a hand (or foot) being touched
FIGURE 2
FIGURE 2
Whole-head view of gradiometers showing grand average waveforms for hand (red) and foot (black) tactile stimulus conditions in Experiment 1. An expanded view shows individual sensors proximal to the hand (top) and foot (bottom) areas of the contralateral somatosensory cortex. Waveforms are shown from −100 to 400 ms relative to touch onset. In presenting grand averages for visual inspection, it should be noted that there was variation in latencies across infants
FIGURE 3
FIGURE 3
Experiment 1: (a) hand and (b) foot touch subject consistency maps showing, at each voxel, the number of infants (out of 14) meeting the p < 10−6 threshold at any time point within the 400 ms window following tactile stimulus onset. The maps are visualized with a lower bound of 11 subjects
FIGURE 4
FIGURE 4
Experiment 1: Spatiotemporal subject partial conjunction (st-sPC) maps showing infant responses to tactile stimulation of hand (column a) and foot (column b). Maps are visualized on inflated cortical surfaces, displaying significant results for the two strongest hypotheses, H 10/140 and H 11/140 (i.e., at least 10 or 11 of the 14 subjects had a real effect, with FDR < 0.05), at example latencies after touch onset. Recurrent patterns of activation were observed in the contralateral S1 (BA3, 1, 2) hand and foot regions in response to hand and foot touch, respectively, and also in parietal (BA5, 7, IPS, IPL) and frontal (BA4, 6, SMA, IFS) areas. SI Movies 1 and 2 provide dynamic visualizations of these st-sPC maps
FIGURE 5
FIGURE 5
Experiment 2: (a) Observed hand touch and (b) observed foot touch subject consistency maps showing, at each voxel, the number of infants (out of 14) meeting the p < .001 threshold at any time point within the 400 ms time window following the rod touching the hand (or foot) in the video stimulus. The maps are visualized with a lower bound of eight subjects
FIGURE 6
FIGURE 6
Experiment 2: Spatiotemporal threshold-free cluster enhancement (TFCE) statistical maps showing increases in infant beta band (12–18 Hz) power relative to the pre-stimulus baseline, that is, the event-related spectral perturbation (ERSP) for (a) observed hand touch and (b) observed foot touch. Maps are thresholded at the TFCE value corresponding to p < .05, after family-wise error rate (FWER) correction for multiple hypotheses. SI Movies 5 and 6 provide dynamic visualizations of these TFCE maps

References

    1. Arichi T, Moraux A, Melendez A, Doria V, Groppo M, Merchant N, Edwards AD. Somatosensory cortical activation identified by functional MRI in preterm and term infants. NeuroImage. 2010;49:2063–2071. - PubMed
    1. Benjamini Y, Heller R. Screening for partial conjunction hypotheses. Biometrics. 2008;64:1215–1222. - PubMed
    1. Bhatt RS, Hock A, White H, Jubran R, Galati A. The development of body structure knowledge in infancy. Child Development Perspectives. 2016;10:45–52. - PMC - PubMed
    1. Buonomano DV, Merzenich MM. Cortical plasticity: From synapses to maps. Annual Review of Neuroscience. 1998;21:149–186. - PubMed
    1. Cuevas K, Cannon EN, Yoo K, Fox NA. The infant EEG mu rhythm: Methodological considerations and best practices. Developmental Review. 2014;34:26–43. - PMC - PubMed

Publication types

LinkOut - more resources