

Carbohydrate dose influences liver and muscle glycogen oxidation and performance during prolonged exercise
- PMID: 29333721
- PMCID: PMC5789655
- DOI: 10.14814/phy2.13555
Carbohydrate dose influences liver and muscle glycogen oxidation and performance during prolonged exercise
Abstract
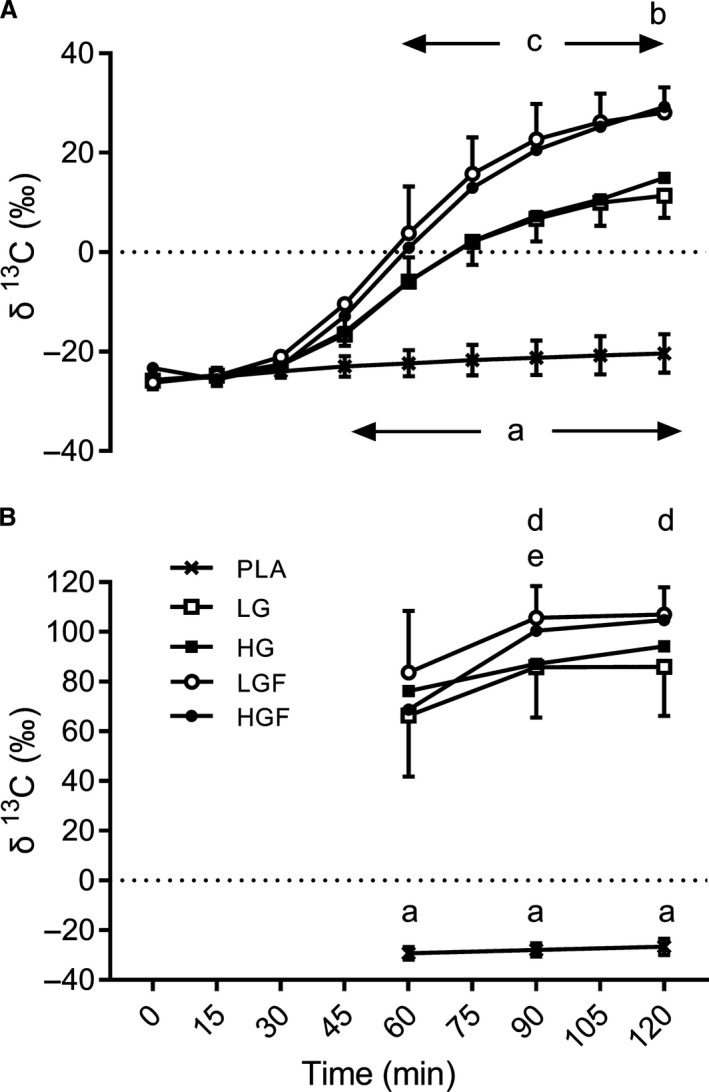
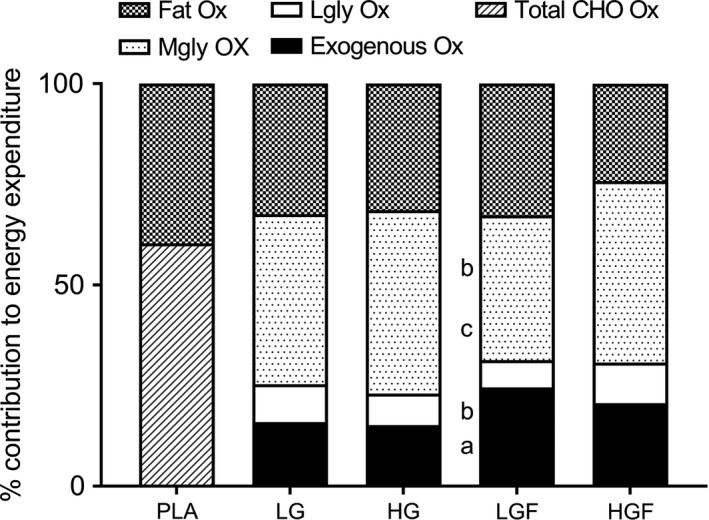
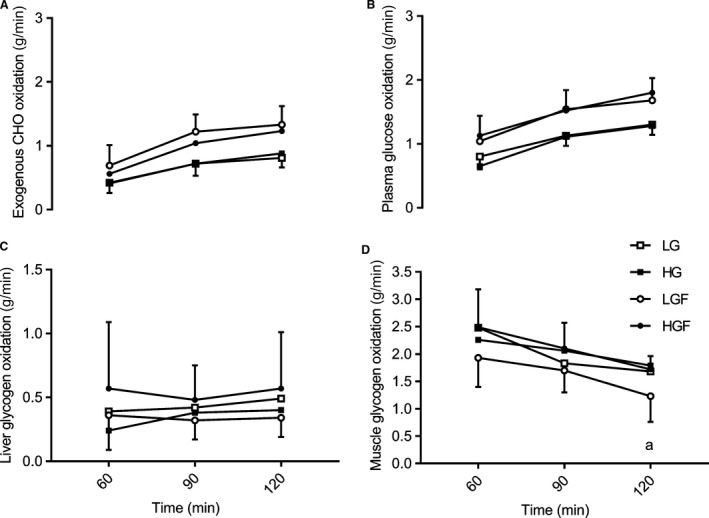
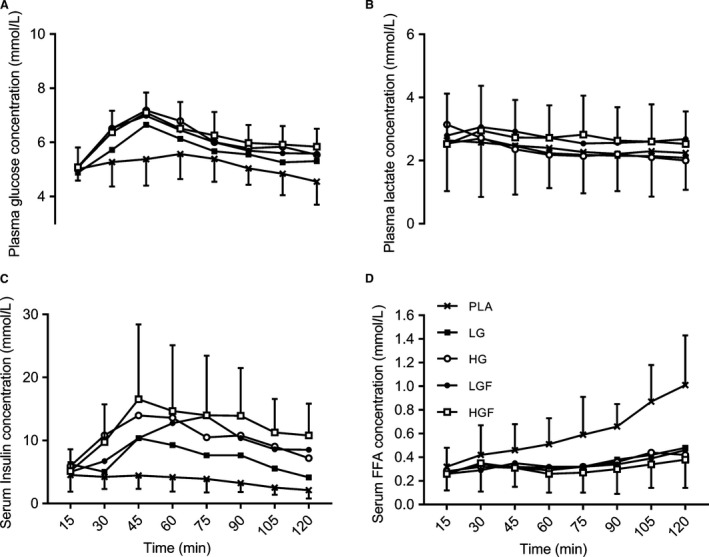
This study investigated the effect of carbohydrate (CHO) dose and composition on fuel selection during exercise, specifically exogenous and endogenous (liver and muscle) CHO oxidation. Ten trained males cycled in a double-blind randomized order on 5 occasions at 77% V˙O2max for 2 h, followed by a 30-min time-trial (TT) while ingesting either 60 g·h-1 (LG) or 75 g·h-113 C-glucose (HG), 90 g·h-1 (LGF) or 112.5 g·h-113 C-glucose-13 C-fructose ([2:1] HGF) or placebo. CHO doses met or exceed reported intestinal transporter saturation for glucose and fructose. Indirect calorimetry and stable mass isotope [13 C] tracer techniques were utilized to determine fuel use. TT performance was 93% "likely/probable" to be improved with LGF compared with the other CHO doses. Exogenous CHO oxidation was higher for LGF and HGF compared with LG and HG (ES > 1.34, P < 0.01), with the relative contribution of LGF (24.5 ± 5.3%) moderately higher than HGF (20.6 ± 6.2%, ES = 0.68). Increasing CHO dose beyond intestinal saturation increased absolute (29.2 ± 28.6 g·h-1 , ES = 1.28, P = 0.06) and relative muscle glycogen utilization (9.2 ± 6.9%, ES = 1.68, P = 0.014) for glucose-fructose ingestion. Absolute muscle glycogen oxidation between LG and HG was not significantly different, but was moderately higher for HG (ES = 0.60). Liver glycogen oxidation was not significantly different between conditions, but absolute and relative contributions were moderately attenuated for LGF (19.3 ± 9.4 g·h-1 , 6.8 ± 3.1%) compared with HGF (30.5 ± 17.7 g·h-1 , 10.1 ± 4.0%, ES = 0.79 & 0.98). Total fat oxidation was suppressed in HGF compared with all other CHO conditions (ES > 0.90, P = 0.024-0.17). In conclusion, there was no linear dose response for CHO ingestion, with 90 g·h-1 of glucose-fructose being optimal in terms of TT performance and fuel selection.
Keywords: Carbohydrate ingestion; exercise; metabolism; muscle glycogen; stable isotope.
© 2018 The Authors. Physiological Reports published by Wiley Periodicals, Inc. on behalf of The Physiological Society and the American Physiological Society.
Figures
Similar articles
-
Liver and muscle glycogen oxidation and performance with dose variation of glucose-fructose ingestion during prolonged (3 h) exercise.Eur J Appl Physiol. 2019 May;119(5):1157-1169. doi: 10.1007/s00421-019-04106-9. Epub 2019 Mar 6. Eur J Appl Physiol. 2019. PMID: 30840136 Free PMC article. Clinical Trial.
-
A comparison of substrate oxidation during prolonged exercise in men at terrestrial altitude and normobaric normoxia following the coingestion of 13C glucose and 13C fructose.Physiol Rep. 2017 Jan;5(1):e13101. doi: 10.14814/phy2.13101. Physiol Rep. 2017. PMID: 28082428 Free PMC article.
-
Fuel Use during Exercise at Altitude in Women with Glucose-Fructose Ingestion.Med Sci Sports Exerc. 2019 Dec;51(12):2586-2594. doi: 10.1249/MSS.0000000000002072. Med Sci Sports Exerc. 2019. PMID: 31206498
-
Human muscle glycogen metabolism during exercise. Effect of carbohydrate supplementation.Sports Med. 1998 Jan;25(1):7-23. doi: 10.2165/00007256-199825010-00002. Sports Med. 1998. PMID: 9458524 Review.
-
Glucose Plus Fructose Ingestion for Post-Exercise Recovery-Greater than the Sum of Its Parts?Nutrients. 2017 Mar 30;9(4):344. doi: 10.3390/nu9040344. Nutrients. 2017. PMID: 28358334 Free PMC article. Review.
Cited by
-
Liver and muscle glycogen oxidation and performance with dose variation of glucose-fructose ingestion during prolonged (3 h) exercise.Eur J Appl Physiol. 2019 May;119(5):1157-1169. doi: 10.1007/s00421-019-04106-9. Epub 2019 Mar 6. Eur J Appl Physiol. 2019. PMID: 30840136 Free PMC article. Clinical Trial.
-
Effects of 120 vs. 60 and 90 g/h Carbohydrate Intake during a Trail Marathon on Neuromuscular Function and High Intensity Run Capacity Recovery.Nutrients. 2020 Jul 15;12(7):2094. doi: 10.3390/nu12072094. Nutrients. 2020. PMID: 32679728 Free PMC article.
-
Carbohydrate ingestion during prolonged exercise blunts the reduction in power output at the moderate-to-heavy intensity transition.Eur J Appl Physiol. 2025 May;125(5):1349-1359. doi: 10.1007/s00421-024-05687-w. Epub 2024 Dec 22. Eur J Appl Physiol. 2025. PMID: 39709586
-
Pioglitazone does not enhance exogenous glucose oxidation or metabolic clearance rate during aerobic exercise in men under acute high-altitude exposure.Am J Physiol Regul Integr Comp Physiol. 2024 Jul 1;327(1):R25-R34. doi: 10.1152/ajpregu.00064.2024. Epub 2024 Apr 29. Am J Physiol Regul Integr Comp Physiol. 2024. PMID: 38682243 Free PMC article. Clinical Trial.
-
A Novel Formula Comprising Wolfberry, Figs, White Lentils, Raspberries, and Maca (WFWRM) Induced Antifatigue Effects in a Forced Exercise Mouse Model.Evid Based Complement Alternat Med. 2022 Mar 24;2022:3784580. doi: 10.1155/2022/3784580. eCollection 2022. Evid Based Complement Alternat Med. 2022. PMID: 35368749 Free PMC article.
References
-
- Adopo, E. , Peronnet F., Massicotte D., Brisson G., and Hillaire‐Marcel C.. 1994. Respective oxidation of exogenous glucose and fructose given in the same drink during exercise. J. Appl. Physiol. 76:1014–1019. - PubMed
-
- Arkinstall, M. , Bruce C., Nikolopoulos V., Garnham A., and Hawley J. A.. 2001. Effect of carbohydrate ingestion on metabolism during running and cycling. J. Appl. Physiol. 91:2125–2134. - PubMed
-
- Baur, D. A. , Schroer A. B., Luden N. D., Womack C. J., Smyth S. A., and Saunders M. J.. 2014. Glucose‐fructose enhances performance versus isocaloric, but not moderate, glucose. Med. Sci. Sports Exerc. 46:1778–1786. - PubMed
-
- Brooks, G. A. 1986. Lactate production under fully aerobic conditions: the lactate shuttle during rest and exercise. Fed. Proc. 45:2924–2929. - PubMed
-
- Casey, A. , Mann R., Banister K., Fox J., Morris P., Macdonald I., et al. 2000. Effect of carbohydrate ingestion on glycogen resynthesis in human liver and skeletal muscle, measured by (13)C MRS. Am. J. Physiol. Endocrinol. Metab. 278:E65–E75. - PubMed
Publication types
MeSH terms
Substances
LinkOut - more resources
Full Text Sources
Other Literature Sources
Medical
Miscellaneous
