. 2018 Jan;6(1):e13554.
doi: 10.14814/phy2.13554.

Cardiovascular adjustments during anticipated postural changes

Affiliations

Cardiovascular adjustments during anticipated postural changes

Neesirg M Patel et al. Physiol Rep. 2018 Jan.

Abstract

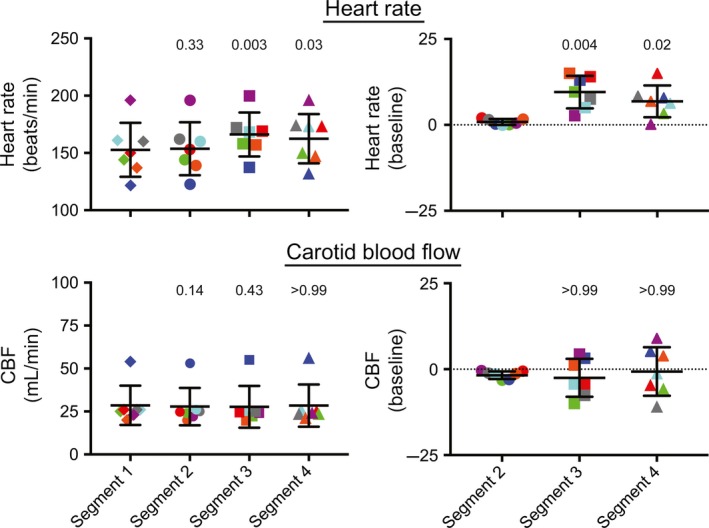
It is well-documented that feedforward cardiovascular responses occur at the onset of exercise, but it is unclear if such responses are associated with other types of movements. In this study, we tested the hypothesis that feedforward cardiovascular responses occur when a passive (imposed) 60° head-up tilt is anticipated, such that changes in heart rate and carotid artery blood flow (CBF) commence prior to the onset of the rotation. A light cue preceded head-up tilts by 10 sec, and heart rate and CBF were determined for 5-sec time periods prior to and during tilts. Even after these stimuli were provided for thousands of trials spanning several months, no systematic changes in CBF and heart rate occurred prior to tilts, and variability in cardiovascular adjustments during tilt remained substantial over time. We also hypothesized that substitution of 20° for 60° tilts in a subset of trials would result in exaggerated cardiovascular responses (as animals expected 60° tilts), which were not observed. These data suggest that cardiovascular adjustments during passive changes in posture are mainly elicited by feedback mechanisms, and that anticipation of passive head-up tilts does not diminish the likelihood that a decrease in carotid blood flow will occur during the movements.

Keywords: Anticipation; cerebral blood flow; conditioned cardiovascular response; orthostatic hypotension; sympathetic nervous system.


Figures

Figure 1
Figure 1
Example of data collected in experiments. Top trace: signal from photometer mounted on the tilt table, indicating the timing of the light cue; Middle trace: recording of pulsatile CBF; Bottom trace: signal from tilt table potentiometer, reflecting table position. Shading shows the four time periods considered for each tilt. Segment 1: 5‐sec period prior to the light cue. Segment 2: 5‐sec period prior to tilt onset (and following the light cue). Segment 3: 5‐sec period commencing at tilt onset. Segment 4: subsequent 5‐sec period when the animal was positioned head‐up.
Figure 2
Figure 2
Changes in heart rate (left side) and CBF (right side) that occurred during every 60° tilt in each animal. Data for the four recording segments (see Fig. 1) are provided separately; the total number of 60° tilts performed for each animal is indicated in Table 1 (in the column “total number of 60° trials”). For designations of heart rate and CBF, the left column indicates raw values, whereas the right column provides the percent changes in values in segments 2, 3, and 4 from those in segment 1 (baseline). Symbols above each group of symbols designate whether the average value is significantly different (using a one‐way ANOVA analysis with Bonferroni correction) from that for the leftmost column of each panel (either baseline heart rate or CBF in segment 1 [left columns] or percent changes from baseline in segment 2 [right columns]). *, P < 0.05; **, P ≤ 0.001; ***P ≤ 0.0001. This figure shows that responses varied considerably from trial‐to‐trial, and were larger in segments 3 and 4 than in segment 2.
Figure 3
Figure 3
Average percent changes in heart rate and CBF during 60° head‐up tilts in the seven animals (the average value for a recording segment in each animal is designated as a single data point). Heart rate is shown in the top panels, while CBF is indicated in the bottom panels. The left panels indicate raw values, whereas the right panels provide the percent changes in values in segments 2, 3, and 4 from those in segment 1 (baseline). Numbers above each group of symbols are P‐values (from a one‐way ANOVA analysis with Bonferroni correction) designating whether the average value is significantly different from that for the leftmost column of each panel (either baseline heart rate or CBF in segment 1 [left panels] or percent changes from baseline in segment 2 [right panels]). Error bars designate one standard deviation. Data for each animal are designated by symbols of different colors: animal 1, red; animal 2, dark blue; animal 3, green; animal 4, purple; animal 5, gray; animal 6, orange; animal 7, light blue. These findings show that heart rate increased during 60° head‐up tilts, but that CBF could either increase or decrease during tilts.
Figure 4
Figure 4
The relationship between the percent changes in heart rate and CBF (from baseline, segment 1) during segment 3. Data from each animal are shown in a separate panel; red lines show a best‐fit of the data from a linear regression analysis. The total number of data points plotted in each panel is shown in Table 1 (in the column “total number of 60 trials”). The P‐value indicating whether the slope was significantly different from non‐zero (F test) and the coefficient of variation showing the goodness of fit of the linear regression with the data are provided in each panel. These findings show that the relationships between changes in heart rate and CBF during tilts were weak, and inconsistent between animals.
Figure 5
Figure 5
The relationship between heart rate and CBF. Each data point designates average values from an animal. Both horizontal and vertical error bars indicate one standard deviation. Red lines show a best‐fit of the data from a linear regression analysis. P values indicating whether the slope was significantly different from non‐zero (F test) as well as R 2 values showing the goodness of fit of the linear regression with the data are provided in each panel. The top panel compares average resting (baseline) heart rate (segment 1) with the average percent change in heart rate from baseline during recording segment 3. The middle panel compares average resting heart rate with the average percent change in CBF during recording segment 3. The bottom panel compares the average percent change in heart rate and the average percent change in CBF during segment 3. These findings show that there were no apparent relationships between resting heart rate and the change in CBF during tilts (middle panel), or the changes in heart rate and CBF during tilts (bottom panel). However, there was an inverse relationship between resting heart rate and the change in heart rate during tilts (top panel).
Figure 6
Figure 6
The mean daily percent change in heart rate (top panels) and CBF (bottom panels) from baseline (segment 1) in segments 2–4 during the first 30 days of testing. Data from each animal are designated by lines of different colors; data for two animals tested for less than 30 days are not shown. Error bars indicate one standard deviation. Typically, ~30 trials were conducted each day, although a few trials were eliminated from averages if animal movement or vocalization were noted, or the tilt velocity and timing did not meet standard parameters (as discussed in Methods). These findings show that there were no systematic changes in responses over time.
Figure 7
Figure 7
The percent changes from baseline (segment 1) in heart rate (left panels) and CBF (right panels) that occurred in each successive trial during the 30th day of testing. Changes in parameters during segment 3 are indicated in the top panels, while those in segment 4 are shown in the bottom panels. Data from the first 25 trials performed are plotted; findings in each animal are indicated by lines of different colors. These findings show that there were no systematic changes in responses over the course of a single testing session.
Figure 8
Figure 8
The percent change from baseline (segment 1) in heart rate (left panels) and CBF (right panels) during periods of 10 recording days (i.e., data for days 1–10, 11–20, and 21–30 were binned for analysis). Vertical dashed lines in each panel separate data for each recording segment. Numbers above each group of symbols are P‐values (from a two‐way ANOVA combined with Bonferroni's correction; factors were recording segment and period) designating whether the average values for days 11–20 or 21–30 were significantly different from those for days 1–10 in each recording segment. The top 5 rows illustrate data for individual trials in each animal, whereas the bottom row shows pooled data from all the animals (the average for a recording segment in an animal is designated by a single data point). In the bottom row (average results), data for each animal are designated by symbols of different colors: animal 1, red; animal 2, dark blue; animal 3, green; animal 4, purple; animal 5, gray. Error bars indicate one standard deviation. These findings complement those in Figure 6, showing that there were no systematic, statistically significant changes in responses over time.
Figure 9
Figure 9
Comparison of percent changes from baseline (segment 1) in heart rate (left panels) and CBF (right panels) during 20° and 60° head‐up tilts. Vertical dashed lines in each panel separate data for each recording segment. Numbers above each group of symbols are P‐values (from a two‐way ANOVA combined with Bonferroni's correction; factors were recording segment and tilt amplitude) designating whether the average values for 20° and 60° tilts differed for each recording segment. The top 5 rows illustrate data for individual trials in each animal, whereas the bottom row shows pooled data from all the animals (the average for a recording segment in an animal is designated by a single data point). In the bottom row (average results), data for each animal are designated by symbols of different colors: animal 1, red; animal 2, dark blue; animal 3, green; animal 4, purple; animal 5, gray. Error bars indicate one standard deviation. The number of 20° and 60° tilts performed in each animal is provided in Table 1. These findings show that responses to 20° tilts were not exaggerated, although animals expected that 60° rotations would occur during these trials.

Similar articles

Cited by

References

    1. Armstrong, R. B. , Hayes D. A., and Delp M. D.. 1989. Blood flow distribution in rat muscles during preexercise anticipatory response. J. Appl. Physiol. 67:1855–1861. - PubMed
    1. Arshian, M. , Holtje R. J., Cotter L. A., Rice C. D., Cass S. P., and Yates B. J.. 2017. Consequences of postural changes and removal of vestibular inputs on the movement of air in and out of the lungs of conscious felines. J. Appl. Physiol. 103:347–352. - PubMed
    1. Blomqvist, C. , and Stone H.. 1983. Cardiovascular adjustments to gravitational stress Pp. 1025–1063 in Shepherd J. T. and Abboud F. M., eds. Handbook of Physiology, The Cardiovascular System, Sect 2 Vol. III American Physiological Society, Bethesda.
    1. Chess, A. C. , Keene C. S., Wyzik E. C., and Bucci D. J.. 2005. Stimulus processing and associative learning in Wistar and WKHA rats. Behav. Neurosci. 119:772–780. - PMC - PubMed
    1. Cohen, D. H. , and Randall D. C.. 1984. Classical conditioning of cardiovascular responses. Annu. Rev. Physiol. 46:187–197. - PubMed

Publication types

LinkOut - more resources