Review
. 2018 Apr;7(8):e1701276.
doi: 10.1002/adhm.201701276. Epub 2018 Jan 15.

Engineering Polymersomes for Diagnostics and Therapy

Affiliations
Review

Engineering Polymersomes for Diagnostics and Therapy

Jiayu Leong et al. Adv Healthc Mater. 2018 Apr.

Abstract

Engineered polymer vesicles, termed as polymersomes, confer a flexibility to control their structure, properties, and functionality. Self-assembly of amphiphilic copolymers leads to vesicles consisting of a hydrophobic bilayer membrane and hydrophilic core, each of which is loaded with a wide array of small and large molecules of interests. As such, polymersomes are increasingly being studied as carriers of imaging probes and therapeutic drugs. Effective delivery of polymersomes necessitates careful design of polymersomes. Therefore, this review article discusses the design strategies of polymersomes developed for enhanced transport and efficacy of imaging probes and therapeutic drugs. In particular, the article focuses on overviewing technologies to regulate the size, structure, shape, surface activity, and stimuli- responsiveness of polymersomes and discussing the extent to which these properties and structure of polymersomes influence the efficacy of cargo molecules. Taken together with future considerations, this article will serve to improve the controllability of polymersome functions and accelerate the use of polymersomes in biomedical applications.

Keywords: bilayer membrane; biomedical; drug delivery; self-assembly; vesicles.


Figures

Figure 1.
Figure 1.
Overview of the design criteria of polymersomes for biomedical applications. These include the size, membrane structure, shape, surface activity of polymersomes and their responsiveness towards internal and external stimuli.
Figure 2.
Figure 2.
Effects of polymer molecular weight (Mn) and volume fraction of hydrophilic block in the entire copolymer (f) on the polymersome diameter (dP). These visualization maps were obtained with the dynamic light scattering (DLS) (a) and freeze-fracture transmission electron microscopy (FF-TEM) (b). Mean polymersome diameter is indicated as full circles (blue and red/orange for DLS and FF-TEM respectively) and the concentric dotted circles indicate mean ± standard deviation. If mean diameter < 400 nm in (a), the circle color is changed to bright blue in and if mean diameter < 400 nm in (b), the circle color is change to bright red. Three regions are indicated: a region with mixed high/medium/low dP values (labeled A), a region with medium/high dP values (labeled B) and a region with medium/low dP values (labeled C). Reproduced with permission.[27]
Figure 3.
Figure 3.
Asymmetrical membranes controlling polymersome surface charge density. TEM images of the polymersomes formed by the following block copolymers: (A) E23-P56-M21; (B) E45-P50-M14; and (C)E113-P84-M13. The white, black and grey chains represent the M block, poly(2-(dimethylamino)ethyl methacrylate); P block, poly(2-(diisopropylamino)ethyl methacrylate); and E block, poly(ethylene oxide), respectively. Reproduced with permission [30].
Figure 4.
Figure 4.
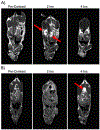
T1 signal magnetic resonance images of C57BL/6 mice at various time points following the intravenous injection of gadolinium-encapsulated porous polymersomes. The local hyperintensity generated by the polymersomes was visualized using a 4.7 T small animal MR. Images of the A) kidney and B) bladder were acquired before injection, and at 2 h and 4 h post-injection, as indicated by the red arrows. Adapted with permission.[51]
Figure 5.
Figure 5.
Schematic depiction of the incorporation of various oligo(porphyrin)-based near infrared fluorophores within polymersomes. A. The near infrared fluorophores vary with the number of porphyrin subunits (N), the linkage topology between porphyrin monomers, and the nature and position of ancillary aryl group substituents (R). Reproduced with permission.[58] B. In vivo fluorescence image of 300 nm-sized NIR-emissive polymersomes taken 10 min after direct tumor injection of a 9L glioma-bearing rat. The intensity remained constant between successive images taken during a 20-min interval post-injection. Adapted with permission.[59] Copyright 2005, National Academy of Sciences. C. In vivo longitudinal tracking of NIR-dendritic cells migrating to the popliteal lymph node. Mice were scanned on days 1, 4, 6, 8, 11, 16, and 33 after a single subcutaneous injection of 105 NIR-dendritic cells into the right footpad. Representative intensity maps (top row) and corresponding lifetime-gated intensity maps (bottom row) for a single mouse are presented for days 4, 6, 11, and 33. The measured signal-to-background ratio for right popliteal lymph node intensity is shown versus day. Each trace (n = 6) represents a different mouse and terminates on the day each animal was sacrificed. Trace with open squares is quantification of the images appearing above. Reproduced with permission.[60] Copyright 2009, Springer.
Figure 6.
Figure 6.
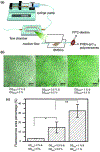
In vitro analysis of the binding affinity of ellipsoidal polymersomes to the model target tissue in a flow chamber. a) The experimental setup of a flow chamber designed to evaluate binding affinity of polymersomes to bone marrow stromal cells sheets. The polymersomes encapsulated with fluorophores were added to media that flowed at a rate of 200 ml/h. b) Confocal microphotographs of bone marrow stromal cells exposed to fluorescent polymersomes modified with varying degree of substitution for poly(ethylene glycol) (DSPEG) and degree of substation for RGD peptides (DSRGD). (c) Quantitative analysis of the effects of DSPEG and DSRGD on the number of polymersomes adhered to bone marrow stromal cell sheets. Reproduced with permission.[68]
Figure 7.
Figure 7.
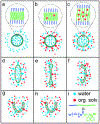
(a–h) Proposed mechanism of the dialysis of polymersomes against 50% water, 40% tetrahydrofuran and 10% 1,4-dioxane. In (a–c), the polymersome membrane is shown enlarged. The organic solvent acts as a plasticizer, which swells the membrane. Swollen membranes are indicated by dashed lines in figures (c–h) compared to the solid lines in figures (a) and (b). (i) Red and blue dots represent organic solvent and water, respectively. The block copolymer is drawn schematically as a short blue line (poly(ethylene glycol)) connected to a longer green line (polystyrene). Reproduced with permission.[74] Copyright 2014, The Royal Society of Chemistry.
Figure 8.
Figure 8.
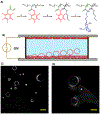
(A) Synthesis of amphiphilic glycopolymers by (a) reversible addition-fragmentation chain-transfer polymerization of pentafluorophenyl acrylate; (b) chain extension with n-butyl acrylate; and (c) displacement of pentafluorophenol by β-D-glucosyloxyethylamine. (B) Schematic of electroformation apparatus for the construction of the giant polymersomes. A polymer film is deposited onto indium tin oxide-coated glass slides, which are separated by a rubber O-ring. The chamber is filled with sucrose solution. A sinusoidal electric field is applied to form giant polymersomes form by budding off from the film on the conductive substrate. (C, D) Fluorescence microscopy images of glycosylated giant polymersomes stained with rhodamine B octadecyl ester perchlorate (scale bar: 20 μm). Reproduced with permission.[84] Copyright 2016, Nature Publishing Group.
Figure 9.
Figure 9.
Synthesis of block copolymers of poly(2-glucosyloxyethyl methacrylate) and poly(diethyleneglycol methacrylate). x=28; y=36. Adapted with permission.[85]
Figure 10.
Figure 10.
Interaction of glycosylated polymersomes with E.coli bacterial cells. (a) polymersomes and cells in the phase contrast mode, (b) same cells in the fluorescence mode. Green and orange red color represent bacterial cells and polymersomes, respectively. Insets in (b) show vesicles at higher image contrast and ×2 magnification. Scale bars: 1 μm. Adapted with permission.[85]
Figure 11.
Figure 11.
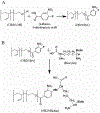
An esterification between the hydroxyl-terminated polymer poly(ethylene glycol)-block-poly(1,2-butadiene) (OB29-OH) and 4-fluoro-3-nitrobenzoic acid linker (A) followed by a nucleophilic aromatic substitution with biocytin to obtain the biotin-coated polymersomes (B). Reproduced with permission.[95]
Figure 12.
Figure 12.
Summary of the various internal stimuli for triggered release of cargos.
Figure 13.
Figure 13.
Illustration of pH-sensitive degradable polymersomes based on poly(ethylene glycol)-block-poly(2,4,6-trimethoxybenzylidenepentaerythritol carbonate) (PEG-b-PTMBPEC) diblock copolymer for triggered release of both hydrophilic and hydrophobic anticancer drugs. Acid-labile acetals in the PTMBPEC block, indicated in red, hydrolyze at pH 5.0 and the encapsulated drugs are released from the polymersomes. Adapted with permission.[130] Copyright 2010, Elsevier.
Figure 14.
Figure 14.
Synthetic route to the pH-responsive copolymers. Poly(ethylene glycol)-block-poly(γ-propargyl l-glutamate) (PEG-b-PPLG) copolymers were first synthesized (first row). Then, the PPLG block, indicated in red, was modified with azido-functionalized tertiary amines, diisopropylamine or diethylamine, by copper catalyzed azide–alkyne cycloaddition to form copolymers 1 to 4. Adapted with permission.[131] Copyright 2014, American Chemical Society.
Figure 15.
Figure 15.
Confocal laser scanning microscope (CLSM) images and colocalization study examining endosomal escape by the rhodamine‐labeled pH-sensitive poly(2-(methacryloyloxy)ethyl phosphorylcholine)-block-poly(2-(diisopropylamino)ethyl methacrylate) (PMPC-b-PDPA) chains. (a) CLSM z‐stack micrographs showing live human dermal fibroblast(HDF) cells containing PMPC-b-PDPA polymersomes loaded with rhodamine octadecyl ester perchlorate B (red color). Polymersomes were then treated with lysotracker (yellow color) and DNA staining SYTO9 (green color). b) CLSM z‐stack micrographs showing live HDF cells incubated with pH-insensitive poly(ethylene glycol)-block-poly(butylene glycol) polymersomes. Polymersomes were loaded with rhodamine octadecyl ester perchlorate B (red color) and DNA staining SYTO9 (green color). Reproduced with permission.[132]
Figure 16.
Figure 16.
(A) Chemical structure of polymersomes with disulfide linkage. (B) Confocal laser scanning microscopy images of HeLa cells incubated for 2 h with (a & b) doxorubicin-loaded polymersomes without disulfide linkage and (c & d) doxorubicin-loaded polymersomes with disulfide linkage [red: doxorubicin (DOX), blue: 4’,6-diamidino-2-phenylindole (DAPI), pink: overlay of DOX and DAPI, scale bar: 20 μm]. Adapted with permission.[138]
Figure 17.
Figure 17.
(A) Types of membrane deformation of polymersomes observed following optical excitation. (B) Membrane rupture of a dextran-encapsulated polymersome following optical excitation (λex = 458, 488, 515, 543, and 633 nm; laser power = 33 mW). Top panels represent phase contrast images and bottom panels represent emitted PZn2 fluorescence images, before and after optical excitation. (C) Frequency of deformation events for different molecular weights of dextran (MW). Reproduced with permission.[145]
Figure 18.
Figure 18.
(A) Chemical structures of complexes of poly(2-vinylpyridine) and 4’-[3,5-di(trideca-2,4-diynyloxyl)]azobenzene-4-sulfonic acid. Before UV irradiation at 254 nm, the azo group exists as a trans isomer. Upon irradiation, the cis isomer has a bent shape that perturbs the ordered structure of the membrane. (B) Cryo-TEM micrographs of the multilayer polymersomes before (left) and after (right) UV irradiation for 45 min. Adapted with permission.[147]
Figure 19.
Figure 19.
Amphiphilic diblock copolymers consisting poly(ethylene oxide) and spiropyran-based monomers containing the carbamate linkage self-assemble into polymersomes with hydrophobic bilayers. Spiropyran moieties within polymersome bilayers undergo reversible isomerization between hydrophobic spiropyran (SP, λ2 > 450 nm irradiation) and zwitterionic merocyanine (MC, λ1 < 420 nm irradiation). Reproduced with permission.[148] Copyright 2015, American Chemical Society.

Similar articles

Cited by

References

    1. Wu NZ, Da D, Rudoll TL, Needham D, Whorton AR, Dewhirst MW, Cancer Res. 1993, 53, 3765. - PubMed
    1. Barenholz Y, J. Control. Release 2012, 160, 117. - PubMed
    1. Sercombe L, Veerati T, Moheimani F, Wu SY, Sood AK, Hua S, Front. Pharmacol 2015, 6, 286. - PMC - PubMed
    1. Uziely B, Jeffers S, Isacson R, Kutsch K, Wei-Tsao D, Yehoshua Z, Libson E, Muggia FM, Gabizon A, J. Clin. Oncol 1995, 13, 1777. - PubMed
    1. Lee H, Larson RG, Biomacromolecules 2016, 17, 1757. - PubMed

Publication types