. 2018 Feb;36(2):197-202.
doi: 10.1038/nbt.4059. Epub 2018 Jan 15.

Visualizing detailed postdoctoral employment trends using a new career outcome taxonomy

Affiliations

Visualizing detailed postdoctoral employment trends using a new career outcome taxonomy

Hong Xu et al. Nat Biotechnol. 2018 Feb.

Abstract

A standard taxonomy and visualization methods can provide postdoctoral scholars with tools to critically evaluate their career prospects.


Conflict of interest statement

COMPETING FINANCIAL INTERESTS

The authors declare no competing financial interests.

Figures
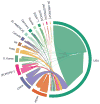
Figure 1
Figure 1
Visualizing alumni migration by pairing country/continent of origin with country/continent of job location. This circular plot displays the countries of origin alongside the countries of job location (arrows point to job locations). Nearly two-thirds of all alumni remain in the US after training, with fellows from Japan, South Korea, the UK and Germany returning to their home countries at greater proportions that the other countries shown. *North American countries excluding US and Canada; **European countries excluding UK, Germany; ***Asian countries excluding China, Japan, India and South Korea. Individual countries with enough alumni to visualize are shown in titlecase. Alumni from remaining countries are grouped and depicted by continent in all caps within enclosed brackets.
Figure 2
Figure 2
Summary of career outcomes within each tier of the taxonomy. Job sector: nearly half of all alumni enter the academic sector, while the remainder largely enter the for-profit or government sector. Approximately 5% are unknown or undecided. Job type: 30% enter into tenure-track positions, while more than one-third enter into professional staff positions, and the rest enter into non-tenure-track, support or trainee-type positions. Job specifics: nearly 70% of all alumni enter into research-based positions, whether basic, applied, clinical, computation/informatics or whether continuing research in another postdoc position. The remainder are mostly involved in science-related non-research positions. Each job specifics category in Supplementary Table 3 that was populated by less than 2.5% of alumni (denoted by * within the table) was grouped into a category termed ‘REST COMBINED’ for ease of illustration.
Figure 3
Figure 3
Relationship between job sectors, job types and job specifics. The width of the lines is proportional to the relative quantity of scholars within each group. Left and middle: division of job sectors by job type. Focusing on the academic sector as an example, it can be seen that while nearly half of all scholars enter into the academic sector, only 29% enter into academic tenure-track positions, as illustrated by the red to light-green transition. The remainder of those in the academic sector are divided between professional, management, support, non-tenure-track or trainee job types. Middle and right: division of job types by job specifics. Focusing on tenure-track positions as an example, it can be seen that the majority are conducting basic research in tenure-track positions (17% overall), which is illustrated by the green to dark-purple transition. Most of the remaining individuals in tenure-track positions are either teaching, or conducting applied or clinical research.
Figure 4
Figure 4
Career outcome variations among US and international scholars. Job sector: significantly more international scholars (purple) than US scholars (green) enter into the academic sector, while more US scholars enter into the for-profit and government sectors. Job type: nearly twice as many international scholars enter into tenure-track faculty positions and trainee positions compared with US scholars. Job specifics: significantly more international scholars (2×) are conducting primarily basic research, while more US scholars are conducting applied research compared with international fellows. ***P < 0.001, **P < 0.01, *P < 0.05. Within this figure, ‘Other’ refers to a pooling of the remaining defined groups, which we combined due to small N-values within individual groups.
Figure 5
Figure 5
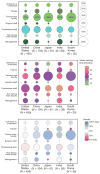
Variations among the ‘Top 5’ countries. Upper panel: job types vary between countries. A higher percentage of alumni from South Korea and Japan enter into tenure-track positions versus the remainder of the ‘top five’ countries based on number of alumni. Middle panel: training times vary between both job types and countries. Individuals from Japan and India entering into professional staff positions train the longest while those entering support staff roles have some of the shortest training times. Lower panel: gender composition varies between both job types and countries. The US has the most gender balance for those in tenure-track positions, while for Japan and South Korea, these positions are weighted toward males. Professional staff positions are more likely to be weighted toward females regardless of country origin. All panels: The legend depicting the size of the circles (10–60%) applies to all panels. Percentages are based on the alumni outcomes within each individual country. For example, all circles on the solid gray line connecting the job types within the US sums to 100% of US alumni. All circles on the solid gray line connecting job types within China sums to 100% of Chinese alumni, etc.
Figure 6
Figure 6
Percentage of alumni that enter into tenure-track positions based on their doctoral degree field. Alumni doctoral degree fields were standardized according to the main program groups defined within NCES’ Biological and Biomedical Sciences instructional programs. The relative percentage of alumni within each degree field entering into tenure-track positions is shown. The 95% confidence intervals for the binomial proportion are shown here. *, the main NCES program group is ‘Biomathematics, Bioinformatics, and Computational Biology;’ ‘Biostatistics’ was substituted for ‘Biomathematics’ and ‘Bioinformatics’ within the title because nearly all alumni in this category possessed a degree in statistics or biostatistics.

References

    1. Cyranoski D, Gilbert N, Ledford H, Nayar A, Yahia M. Nature. 2011;472:276–279. - PubMed
    1. National Science Foundation, National Center for Science and Engineering Statistics. Doctorate Recipients from US Universities: 2014. National Science Foundation; Arlington: 2015. NSF Special Report 16–300.
    1. Institute of Medicine, National Academy of Sciences, and National Academy of Engineering. Enhancing the Postdoctoral Experience for Scientists and Engineers: a Guide for Postdoctoral Scholars, Advisers, Institutions, Funding Organizations, and Disciplinary Societies. The National Academies Press; Washington, D.C: 2000. - DOI - PubMed
    1. National Academy of Sciences, National Academy of Engineering, and Institute of Medicine. The Postdoctoral Experience Revisited. The National Academies Press; Washington: 2014. - DOI - PubMed
    1. Allum J, Kent J, McCarthy M. Understanding PhD Career Pathways for Program Improvement: a CGS Report. Council of Graduate Schools; Washington: 2014.

Publication types

LinkOut - more resources