Comment
. 2018 Feb;24(2):130-143.
doi: 10.1038/nm.4473. Epub 2018 Jan 15.

Prevention of tuberculosis in rhesus macaques by a cytomegalovirus-based vaccine

Affiliations
Comment

Prevention of tuberculosis in rhesus macaques by a cytomegalovirus-based vaccine

Scott G Hansen et al. Nat Med. 2018 Feb.

Abstract

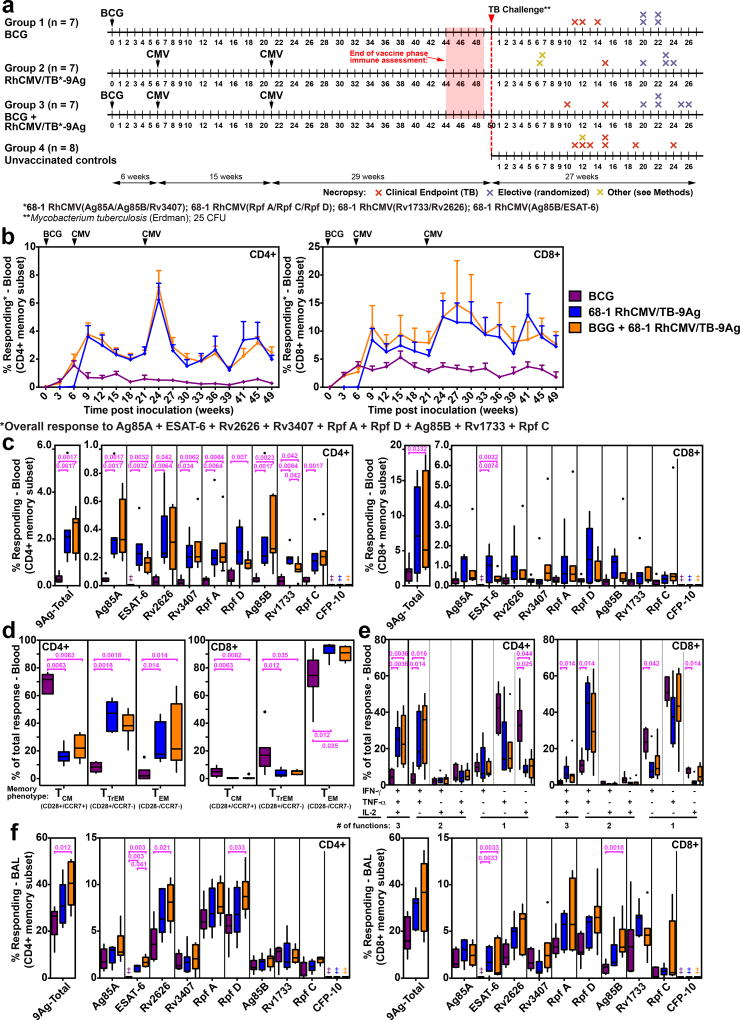
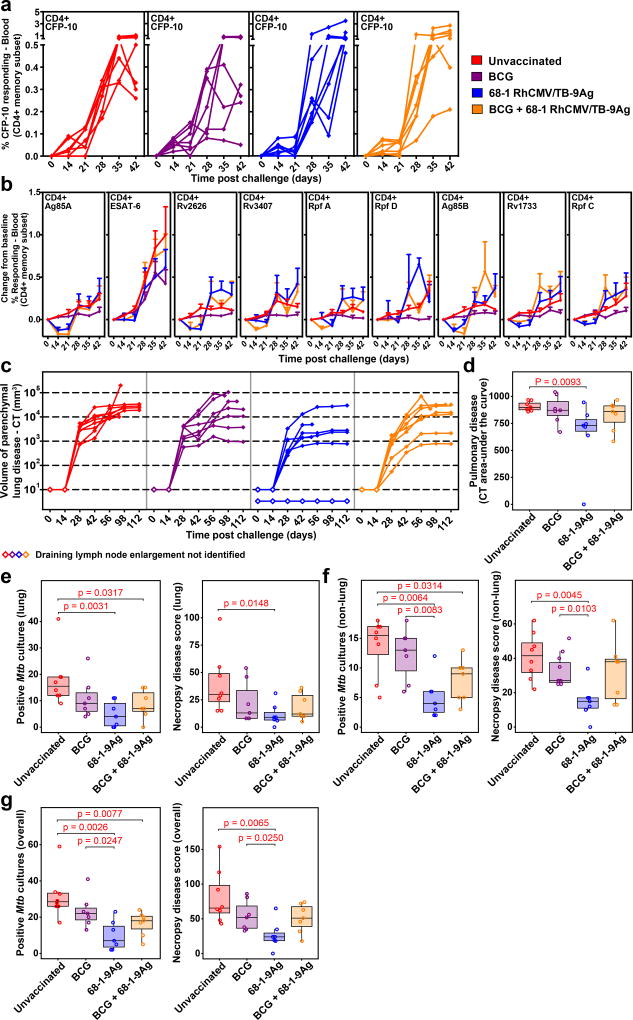
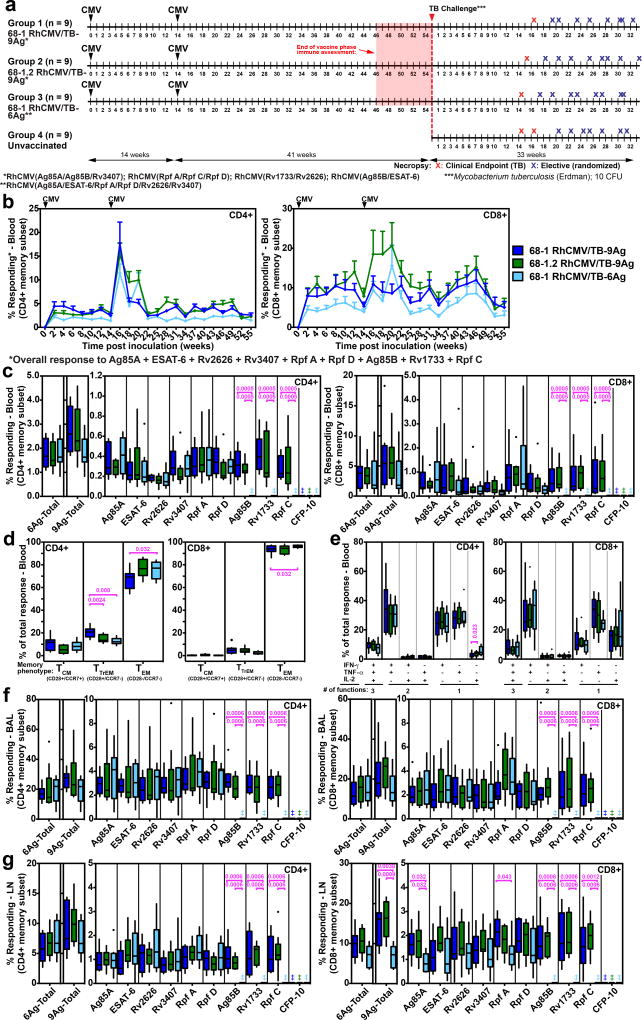
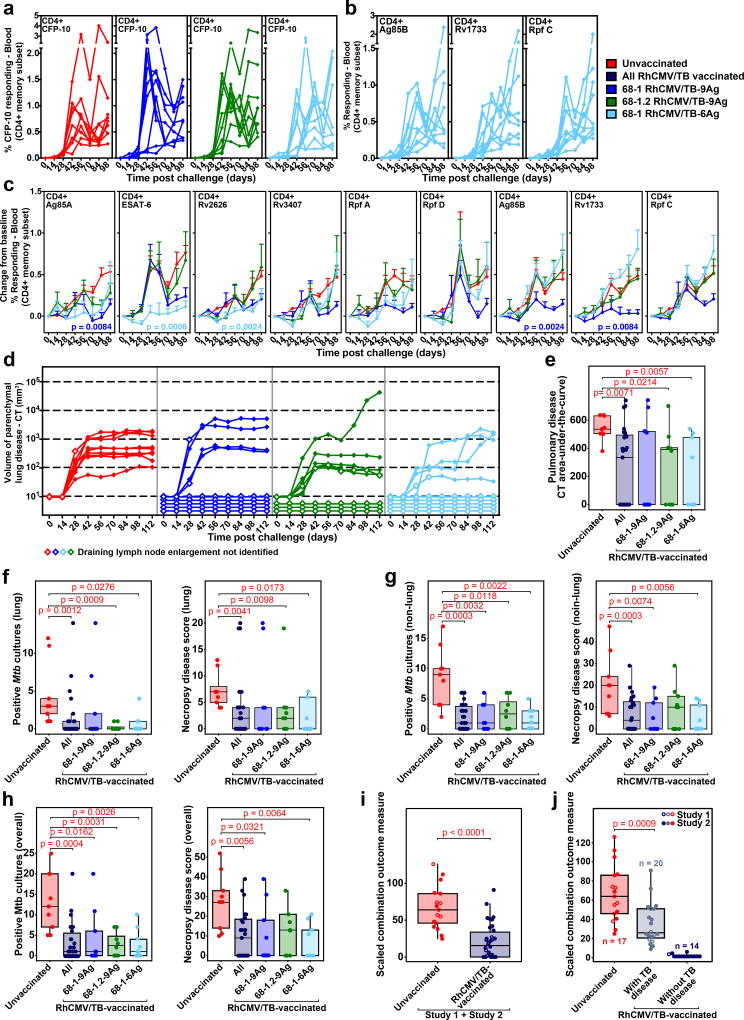
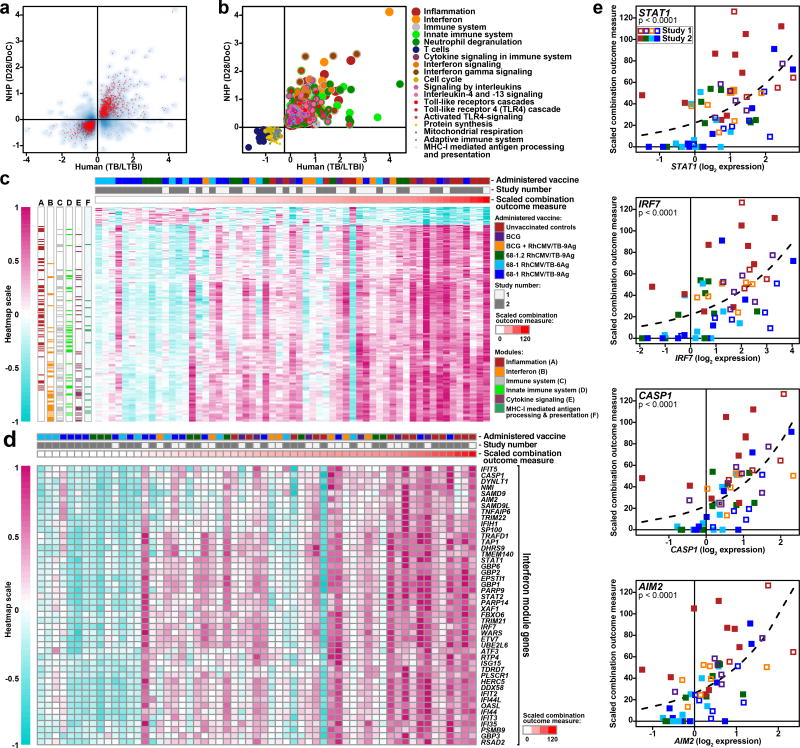
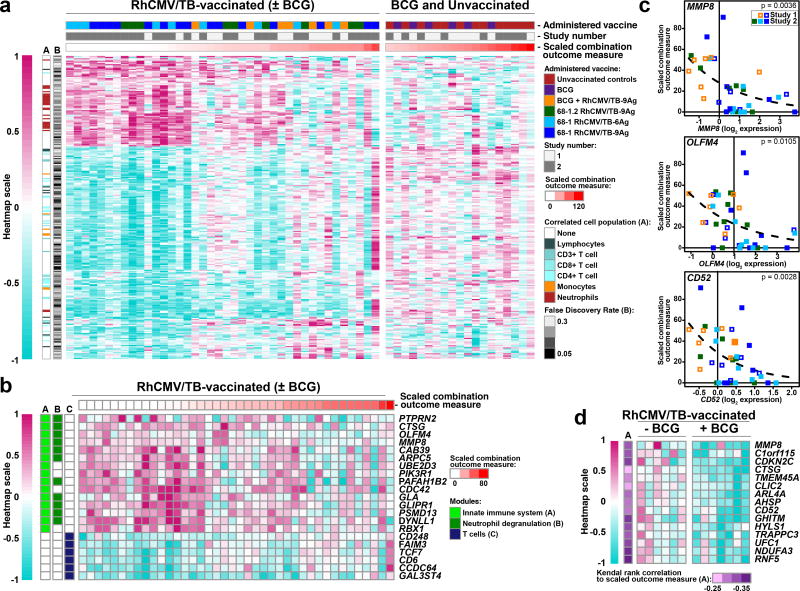
Despite widespread use of the bacille Calmette-Guérin (BCG) vaccine, tuberculosis (TB) remains a leading cause of global mortality from a single infectious agent (Mycobacterium tuberculosis or Mtb). Here, over two independent Mtb challenge studies, we demonstrate that subcutaneous vaccination of rhesus macaques (RMs) with rhesus cytomegalovirus vectors encoding Mtb antigen inserts (hereafter referred to as RhCMV/TB)-which elicit and maintain highly effector-differentiated, circulating and tissue-resident Mtb-specific CD4+ and CD8+ memory T cell responses-can reduce the overall (pulmonary and extrapulmonary) extent of Mtb infection and disease by 68%, as compared to that in unvaccinated controls, after intrabronchial challenge with the Erdman strain of Mtb at ∼1 year after the first vaccination. Fourteen of 34 RhCMV/TB-vaccinated RMs (41%) across both studies showed no TB disease by computed tomography scans or at necropsy after challenge (as compared to 0 of 17 unvaccinated controls), and ten of these RMs were Mtb-culture-negative for all tissues, an exceptional long-term vaccine effect in the RM challenge model with the Erdman strain of Mtb. These results suggest that complete vaccine-mediated immune control of highly pathogenic Mtb is possible if immune effector responses can intercept Mtb infection at its earliest stages.


Figures

Figure 1
Figure 1. Immunogenicity of RhCMV/TB and i.d. BCG vaccines (Study 1)
(a) Schematic of the RM groups, (n=29 biologically independent animals), vaccination and challenge protocols, and necropsy time points of Study 1. (b) Longitudinal analysis of the overall CD4+ and CD8+ T cell response to the 9 Mtb insert proteins after vaccination. The background-subtracted frequencies of cells producing TNF and/or IFN-γ by flow cytometric ICS assay to peptide mixes comprising each of the Mtb proteins within the memory CD4+ or CD8+ T cell subsets were summed with the figure showing the mean (+ SEM; n=7 per group) of these overall (summed) responses at each time point. (c) Boxplots compare the individual Mtb protein (each of the 9 Mtb inserts plus the non-insert CFP-10)-specific and overall (summed) Mtb-specific CD4+ and CD8+ T cell response frequencies (defined by TNF and/or IFN-γ production) in peripheral blood between the same vaccine groups as in b at the end of the vaccine phase (each data point is the mean of response frequencies in 3 separate samples from weeks 44–49; indicates no response detected). (d) Boxplots compare the memory differentiation of the vaccine-elicited CD4+ and CD8+ memory T cells in peripheral blood responding to Ag85A with TNF and/or IFN-γ production at the end of vaccine phase (week 47). Memory differentiation state was based on CD28 vs. CCR7 expression, delineating central memory (TCM), transitional effector memory (TTREM), and effector memory (TEM), as designated. (e) Boxplots compare the frequency of vaccine-elicited CD4+ and CD8+ memory T cells in peripheral blood responding to Ag85A with TNF, IFN-γ and IL-2 production, alone and in all combinations at the end of vaccine phase (week 49). (f) Boxplots compare the individual Mtb protein-specific and overall (summed) Mtb-specific CD4+ and CD8+ T cell response frequencies (defined by TNF and/or IFN-γ production) in bronchoalveolar lavage (BAL) fluid between the vaccine groups at the end of the vaccine phase (weeks 46–47). In c–f, plots show a box from 1st to 3rd quartiles (IQR) and a line at the median, with whiskers extending to the farthest data point within 1.5*IQR above and below the box respectively; all data points outside of the whiskers are plotted individually; the Kruskal-Wallis (KW) test was used to determine the significance of differences between vaccine groups with the Wilcoxon rank sum test used to perform pair-wise analysis if KW p-values were ≤0.05; brackets indicate pair-wise comparisons with Holm-adjusted, two-sided Wilcoxon p-values ≤0.05 (with actual p-values shown; n=7 per group).
Figure 2
Figure 2. Outcome of Mtb challenge (Study 1)
(a) Development of peripheral blood CD4+ T cell responses to the peptide mixes comprising the non-vaccine insert Mtb protein CFP-10 after Mtb challenge by flow cytometric ICS analysis (response defined by TNF and/or IFN-γ production after background subtraction in memory subset; CFP-10-specific CD8+ T cell responses shown in Supplementary Fig. 2a). (b) Mean (+ SEM; n=7 per vaccine group; n=6 unvaccinated RM) change in peripheral blood CD4+ T cell response frequencies to peptide mixes comprising the vaccine insert Mtb proteins after Mtb challenge from pre-challenge baseline by flow cytometric ICS analysis (response defined as in a; analogous CD8+ T cell responses shown in Supplementary Fig. 2b). There were no significant differences in post-challenge change-from-baseline response dynamics between unvaccinated RM and any of the vaccine groups (see Methods). (c) CT quantification of disease volume in the pulmonary parenchyma after Mtb challenge (presence or absence of draining LN enlargement indicated by closed vs. open symbols). (d) Boxplots compare the AUC of CT-determined pulmonary lesional volume (day 0–112; see Methods) of the 4 RM groups. (e–g) Boxplots compare the extent of TB at necropsy measured by Mtb recovery with mycobacterial culture and by pathologic disease score (see Methods) in lung parenchyma (e), all non-lung parenchymal tissues (f) and all tissues (g). In c–g, n=7 per vaccine group and n=8 unvaccinated RM; in d–g, plots show jittered points with a box from 1st to 3rd quartiles (IQR) and a line at the median, with whiskers extending to the farthest data point within 1.5*IQR above and below the box respectively; unadjusted two-sided Wilcoxon p-values ≤0.05 are shown (see also Supplementary Fig. 4a).
Figure 3
Figure 3. Immunogenicity of RhCMV/TB vaccines (Study 2)
(a) Schematic of RM groups, vaccination and challenge protocols, and necropsy time points of Study 2 (n=36 biologically independent animals). (b) Longitudinal analysis of the overall CD4+ and CD8+ T cell response to the 9 Mtb Ags after vaccination, as described in Fig. 1b (n=9 per group). (c) Boxplots compare the individual Mtb protein (each of the 9 Mtb inserts plus the non-insert CFP-10)-specific and overall (summed) Mtb-specific CD4+ and CD8+ T cell response frequencies (defined by TNF and/or IFN-γ production) in peripheral blood between the vaccine groups at the end of the vaccine phase (each data point is the mean of response frequencies in 3 separate samples from weeks 49–55; indicates no response detected). (d) Boxplots compare the memory differentiation phenotypes (see Fig. 1d) of the vaccine-elicited CD4+ and CD8+ memory T cells in peripheral blood responding to Ag85A with TNF and/or IFN-γ production at the end of vaccine phase (weeks 51–52). (e) Boxplots compare the frequency of vaccine-elicited CD4+ and CD8+ memory T cells in peripheral blood responding to Ag85A with TNF, IFN-γ and/or IL-2, alone and in all combinations at the end of vaccine phase (weeks 49–50). (f,g) Boxplots compare the individual Mtb protein (the 9 Mtb inserts plus the non-insert CFP-10)-specific and overall (summed) Mtb-specific CD4+ and CD8+ T cell response frequencies (defined by TNF and/or IFN-γ production) in BAL (f) and in peripheral LN (g) between the vaccine groups at the end of vaccine phase (weeks 46–47). In c–g, plots show a box from 1st to 3rd quartiles (IQR) and a line at the median, with whiskers extending to the farthest data point within 1.5*IQR above and below the box respectively; all data points outside of the whiskers are plotted individually. Statistics were performed as described in Fig. 1 with brackets indicating pair-wise comparisons with Holm-adjusted, two-sided Wilcoxon p-values ≤0.05 (with actual p-values shown; n=9 per group).
Figure 4
Figure 4. Outcome of Mtb challenge (Study 2 and Overall)
(a,b) Development of peripheral blood CD4+ T cell responses to the peptide mixes comprising the non-vaccine insert Mtb protein CFP-10 in all Study 2 RM (a), and comprising the Ag85B, Rv1733 and Rpf C proteins in group 3 RM only (b; RM vaccinated with the single 68-1 RhCMV/TB-6Ag vector lacking these 3 inserts) after Mtb challenge by flow cytometric ICS analysis, as described in Fig. 2a (peripheral blood CD8+ T cell responses and tissue CD4+ and CD8+ T cell responses to these same Ags are shown in Supplementary Figs. 2c,d and 8, respectively). (c) Mean (+ SEM; n=9 per group) change in peripheral blood CD4+ T cell response frequencies to peptide mixes comprising the vaccine insert Mtb proteins after Mtb challenge from pre-challenge baseline by flow cytometric ICS analysis, as described in Fig. 2b (analogous CD8+ T cell responses shown in Supplementary Fig. 2e). Holm-adjusted Wilcoxon p-values ≤0.05 are shown for change-from-baseline AUC values of post-challenge responses in any of the vaccinated groups versus the unvaccinated controls. (d) CT scan-based quantification of disease volume in the pulmonary parenchyma after Mtb challenge (presence or absence of draining LN enlargement indicated by closed and open symbols, respectively; n=9 per group). (e) Boxplots compare the AUC values of CT scan-determined pulmonary lesional volume (day 0–112) of the unvaccinated RM vs. all RhCMV/TB-vaccinated RM vs. RM in each individual RhCMV/TB vaccine group (n=9 per group). (f–h) Boxplots compare the extent of TB at necropsy measured by Mtb recovery with mycobacterial culture and by pathologic disease score in lung parenchyma (f), all non-lung parenchymal tissues (g) and all tissues (h) in the same RM groups as in e. (i,j) The boxplots and unadjusted two-sided Wilcoxon test p-values compare the outcome of Mtb challenge in all unvaccinated RM vs. all RhCMV/TB only-vaccinated RM across both Study 1 (n=8 vs. n=7) and Study 2 (n=9 vs. n=27) using a scaled outcome measure that combines both Mtb culture and pathologic score data (see Methods). In (j), the RhCMV/TB-vaccinated RM are divided into 2 groups based on presence (n=20) or absence (n=14) of granulomatous disease at necropsy (necropsy pathologic score ≥4 vs. =0, respectively) vs. n=17 unvaccinated RM. In e–j, plots show jittered points with a box from 1st to 3rd quartiles (IQR) and a line at the median, with whiskers extending to the farthest data point within 1.5*IQR above and below the box respectively (unadjusted, two-sided Wilcoxon p-values ≤0.05 are shown; see also Supplementary Fig. 4).
Figure 5
Figure 5. Transcriptional response to Mtb challenge reduced in protected RM
(a) The median longitudinal log2 gene expression fold-change between 28 days after challenge and the day of challenge in unvaccinated RM from Study 1 and 2 (n=13; y-axis) is plotted against the average median log2 expression difference computed between HIV-negative active TB patients and latent TB infection controls from South Africa (TB: n=46, LTBI: n=48) and Malawi (TB: n=51, LTBI: n=35) (x axis) for 3406 significantly regulated genes identified in the human study. Genes significantly regulated in Mtb-challenged, unvaccinated RM are shown in red (one-sided, paired Wilcoxon rank sum test, p<0.05; FDR<0.33; complete list of p-values shown in Supplementary Table 1). The overall Spearman rank correlation coefficient between expression fold-changes in the human study and RM for all 3406 genes is 0.58. (b) Commonly up-regulated (n=793) or down-regulated (n=689) genes in humans with TB disease and unvaccinated Study 1 + 2 RM (n=13) 28 days after Mtb infection from panel a were tested for significant over-representation of transcriptional modules and immune pathways (Reactome) (p<0.002, FDR<0.01;one-sided Fisher’s Exact Test), which were then color-coded according to significance and pathway membership. Enrichment p-values ranged from p<10−40 for inflammation and interferon, to p=2×10⁻³ for Class I MHC (complete list of p-values shown in Supplementary Table 2). (c) The heatmap depicts scaled expression fold-changes for all 214 genes (rows) for all Study 1 and 2 RM (columns; n=59) ordered by scaled combination outcome measure (red bar at top). Post-challenge expression fold-changes for 214/1482 commonly regulated genes in panel a were strongly associated with the scaled combination outcome measure as indicated by Poisson modeling (p<0.05, FDR<0.1; complete list of p-values shown in Supplementary Table 3). Genes with fold-changes positively associated with outcome are significantly enriched for the interferon transcriptional module (FDR=3×10⁻²⁷) and other pathways (Supplementary Table 4). Day 28/Day of challenge log2 fold-changes were scaled by the maximum absolute log2 fold-change observed. Annotations of genes to significantly over-represented pathways are shown in colored boxes at the left side of the heatmap. (d) Heatmap as in panel c showing expression profiles of 46 genes from the interferon transcriptional module. (e) Scatterplots depicting scaled combination outcome measure (y axis) as a function of Day 28/Day of challenge log2 fold-changes for representative genes from the interferon transcriptional module. The dashed line indicates the best-fit Poisson model. P-values indicate the significance of the regression coefficient in a sandwich-adjusted Poisson model (n=59) for the association between gene expression and the scaled combination outcome measure.
Figure 6
Figure 6. Pre-challenge transcriptional profiles correlate with post-challenge outcome in RhCMV/TB-vaccinated RM
(a) Heatmap visualization of the relative gene expression (log2 expression fold-change) of genes expressed in the whole blood immediately prior to challenge of RhCMV/TB-vaccinated RM (with or without i.d. BCG) from Study 1 + 2 that are significantly associated with the scaled combination outcome measure by Poisson modeling (p<0.05, FDR<0.33; FDR values are shown in the heatmap and all p-values are shown in Supplementary Table 5; n=40 RM), and are not associated with outcome for the unvaccinated and i.d. BCG-vaccinated RM (p>0.2; n=19 RM). The left and right sides of the heatmap show expression of the genes in RhCMV/TB-vaccinated vs. unvaccinated or i.d. BCG-vaccinated RM, respectively. The heatmap also delineates whether the expression of each gene correlates with the absolute counts of any of the designated leukocyte populations in the same blood sample (if more than one population correlates, the strongest association is shown; complete results are shown in Supplementary Table 7). Note that genes positively associated with eventual disease are significantly enriched for genes associated with T cell counts (FDR<0.05; one-sided Fisher’s Exact Test; p-values values provided in Supplementary Table 8), whereas genes negatively associated with eventual disease (positively correlated with RhCMV/TB-mediated protection) are significantly enriched for genes associated with neutrophil counts (FDR=3×10⁻³). (b) The testing of genes in panel a (protection signature: n=77 genes; susceptibility signature: n=181 genes) for over-representation of transcriptional modules and pathways revealed three significant results (p<0.05, FDR<0.15, one-sided Fisher’s Exact Test), indicated by the colored bars on the left of the heatmap (p-values provided in Supplementary Table 6). The heatmap shows the relative expression of specific genes (same scale as in panel a) with pre-challenge associations with the scaled combination outcome measure that belong to the significantly enriched modules and pathways. (c) Scatterplots depicting scaled combination outcome measure (y-axis) as a function of pre-challenge expression of representative protection-associated genes from the neutrophil degranulation module (MMP8 and OLFM4, the latter expressed by a neutrophil subset), as well as CD52, a broadly expressed gene that is also expressed by neutrophils. The dashed line indicates the best-fit Poisson model (The p-values shown indicate the sandwich-adjusted Poisson p-values for the association between pre-challenge gene expression and the scaled combination outcome measure; n=40 RM). (d) Heatmap visualization of 15 genes from panel a with protection-associated pre-challenge expression levels which exhibit significantly reduced expression on the day of challenge (one-sided Wilcoxon tests p<0.05, FDR<0.33) in RM vaccinated with i.d. BCG prior to RhCMV/TB vaccination (n=7) compared to RM vaccinated with RhCMV/TB only (n=6) from Study 1. See Methods for details of data preparation for visualization.

Comment in

Comment on

References

    1. Cambier CJ, Falkow S, Ramakrishnan L. Host evasion and exploitation schemes of Mycobacterium tuberculosis. Cell. 2014;159:1497–1509. - PubMed
    1. Orme IM, Robinson RT, Cooper AM. The balance between protective and pathogenic immune responses in the TB-infected lung. Nat Immunol. 2015;16:57–63. - PubMed
    1. Shaler CR, Horvath CN, Jeyanathan M, Xing Z. Within the Enemy’s Camp: contribution of the granuloma to the dissemination, persistence and transmission of Mycobacterium tuberculosis. Front Immunol. 2013;4:30. - PMC - PubMed
    1. Pai M, et al. Tuberculosis. Nat Rev Dis Primers. 2016;2:16076. - PubMed
    1. Comas I, et al. Human T cell epitopes of Mycobacterium tuberculosis are evolutionarily hyperconserved. Nat Genet. 2010;42:498–503. - PMC - PubMed

Publication types

MeSH terms