

Efficacy comparison of multi-phase CT and hepatotropic contrast-enhanced MRI in the differential diagnosis of focal nodular hyperplasia: a prospective cohort study
- PMID: 29334905
- PMCID: PMC5769413
- DOI: 10.1186/s12876-017-0719-1
Efficacy comparison of multi-phase CT and hepatotropic contrast-enhanced MRI in the differential diagnosis of focal nodular hyperplasia: a prospective cohort study
Abstract
Background: Different clinical behaviour influences the importance of differentiating focal nodular hyperplasia (FNH) from other focal liver lesions (FLLs). The aim of this study was to compare the efficacy of contrast-enhanced CT and MRI in the diagnosis of FNH.
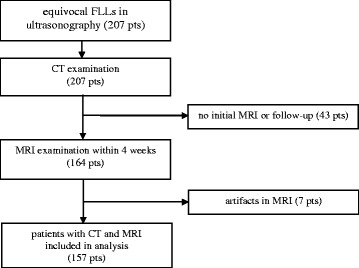
Methods: 157 patients with equivocal FLLs detected in ultrasonography subsequently underwent multi-phase CT and MRI with the use of hepatotropic contrast agent (Gd-BOPTA) in a 1.5 T scanner. Examinations were evaluated by three independent readers. Diagnostic efficacy of different radiological signs of FNH in both CT and MRI was compared and AFROC analysis was performed.
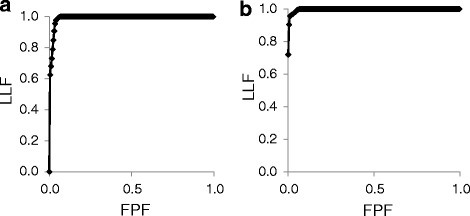
Results: 4 hepatocellular adenomas, 95 hepatocellular carcinomas, 98 hemangiomas, 138 metastases and 45 FNHs were diagnosed. In both CT and MRI the radiological sign of the highest accuracy was the presence of the central scar within FNH (0.93 and 0.96 relatively). The sum of two radiological signs in MRI: homogeneous enhancement in hepatic arterial phase (HAP) and enhancing lesion in hepatobiliary phase (HBP) was characterized with high values of sensitivity (0.89), specificity (0.97), PPV (0.82), NPV (0.98) and accuracy (0.96). After inclusion of clinical data into analysis the best discriminating feature in MRI was the presence of enhancing lesion in HBP in patients without cirrhosis. In this regard, efficacy parameters increased to 1.00, 0.99, 0.94, 1.00 and 0.99 accordingly. The area under the curve in AFROC analysis of MRI performance was significantly larger than of CT (p = 0.0145).
Conclusion: Gd-BOPTA-enhanced MRI is a more effective method in the differential diagnosis of FNH than multi-phase CT.
Keywords: AFROC; Computed tomography; Differential diagnosis; Focal nodular hyperplasia; Gadobenate Dimeglumine; Hepatobiliary phase; Magnetic resonance imaging.
Conflict of interest statement
Ethics approval and consent to participate
The research was approved by The Independent Bioethics Committee for Scientific Research of the Medical University of Gdansk, Poland (NKEBN/649/01–02). All patients gave their informed written consent to participate.
Consent for publication
Not applicable.
Competing interests
The authors declare that they have no competing interests.
Publisher’s Note
Springer Nature remains neutral with regard to jurisdictional claims in published maps and institutional affiliations.
Figures

References
-
- Hirohashi S, Ishak K, Koijro M, Wanless I, Theise N, Tsukuma H, Blum H. Hepatocellular carcinoma. In: Pathology & Genetics. Tumours of the digestive system. Chapter 8: Tumours of the liver and intrahepatic bile ducts, IARCPress, Lyon, 2000. p. 169.
-
- Goodman ZD, Terracciano LM. Tumours and tumour-like lesions of the liver. In: Burt AD, Portmann BC, Ferrell LD, editors. MacSween’s pathology of the liver. 5. Philadelphia: Churchill Livingstone Elsevier; 2007. pp. 761–814.
Publication types
MeSH terms
Substances
Grants and funding
LinkOut - more resources
Full Text Sources
Other Literature Sources
Medical
Miscellaneous
