The surprising implications of familial association in disease risk
- PMID: 29334951
- PMCID: PMC5769446
- DOI: 10.1186/s12889-018-5033-5
The surprising implications of familial association in disease risk
Abstract
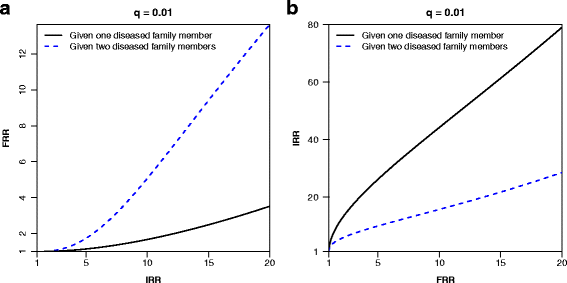
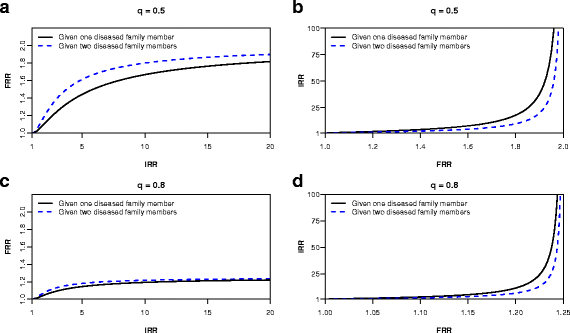
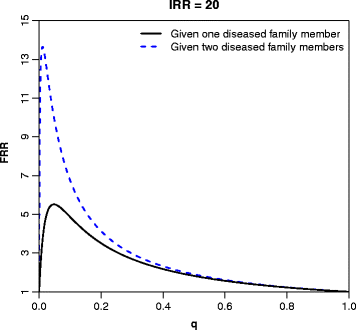
Background: A wide range of diseases show some degree of clustering in families; family history is therefore an important aspect for clinicians when making risk predictions. Familial aggregation is often quantified in terms of a familial relative risk (FRR), and although at first glance this measure may seem simple and intuitive as an average risk prediction, its implications are not straightforward.
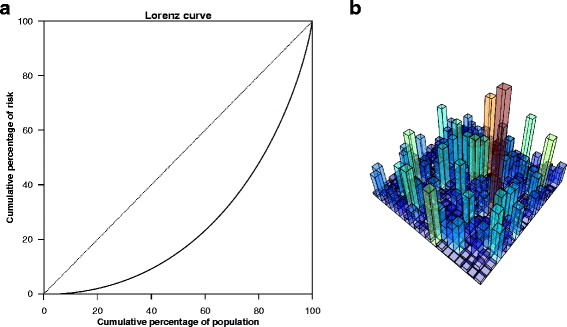
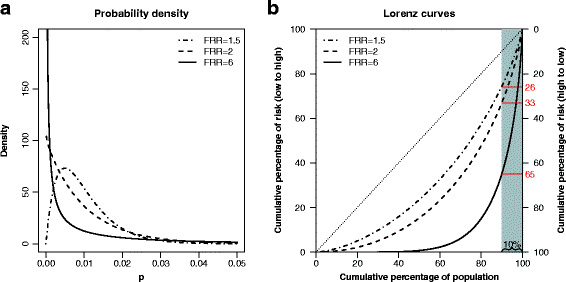
Methods: We use two statistical models for the distribution of disease risk in a population: a dichotomous risk model that gives an intuitive understanding of the implication of a given FRR, and a continuous risk model that facilitates a more detailed computation of the inequalities in disease risk. Published estimates of FRRs are used to produce Lorenz curves and Gini indices that quantifies the inequalities in risk for a range of diseases.
Results: We demonstrate that even a moderate familial association in disease risk implies a very large difference in risk between individuals in the population. We give examples of diseases for which this is likely to be true, and we further demonstrate the relationship between the point estimates of FRRs and the distribution of risk in the population.
Conclusions: The variation in risk for several severe diseases may be larger than the variation in income in many countries. The implications of familial risk estimates should be recognized by epidemiologists and clinicians.
Keywords: Familial association; Familial relative risk; Gini index; Inequality; Lorenz curve.
Conflict of interest statement
Ethics approval and consent to participate
Not applicable.
Consent for publication
Not applicable.
Competing interests
The authors declare that they have no competing interests.
Publisher’s Note
Springer Nature remains neutral with regard to jurisdictional claims in published maps and institutional affiliations.
Figures
References
-
- Riley BD, Culver JO, Skrzynia C, Senter LA, Peters JA, Costalas JW, et al. Essential elements of genetic cancer risk assessment, counseling, and testing: updated recommendations of the National Society of Genetic Counselors. J Genet Counsel. 2012;21(2):151–61. doi: 10.1007/s10897-011-9462-x. - DOI - PubMed
Publication types
MeSH terms
Grants and funding
LinkOut - more resources
Full Text Sources
Other Literature Sources
Medical

