. 2018 Jan 15;9(1):224.
doi: 10.1038/s41467-017-02317-2.

Causal associations between risk factors and common diseases inferred from GWAS summary data

Affiliations

Causal associations between risk factors and common diseases inferred from GWAS summary data

Zhihong Zhu et al. Nat Commun. .

Abstract

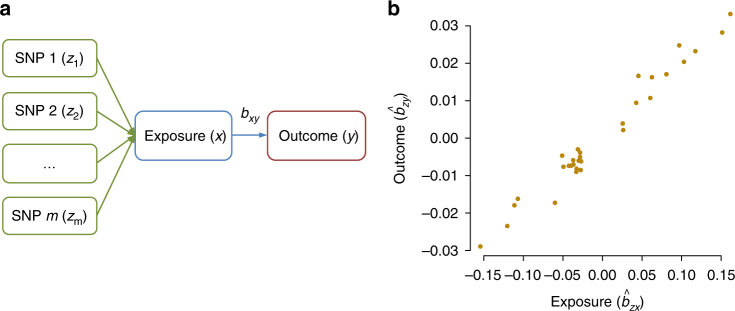
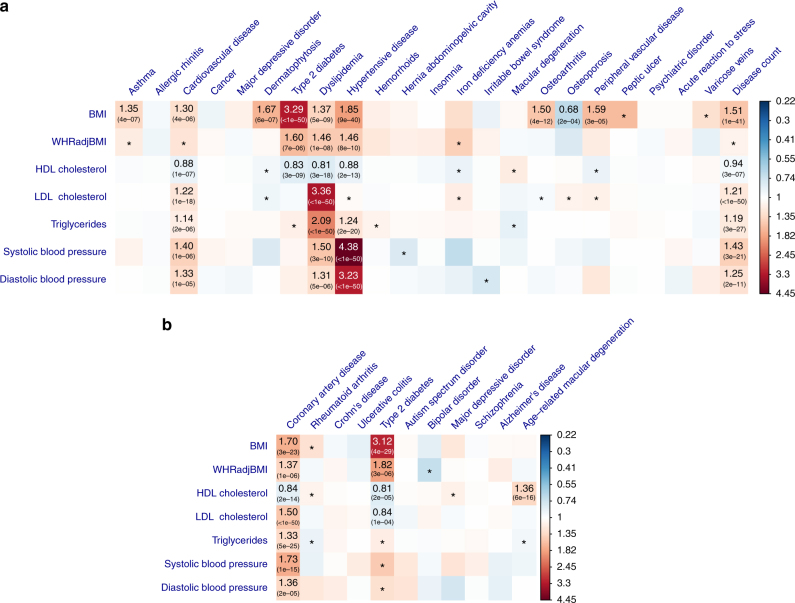
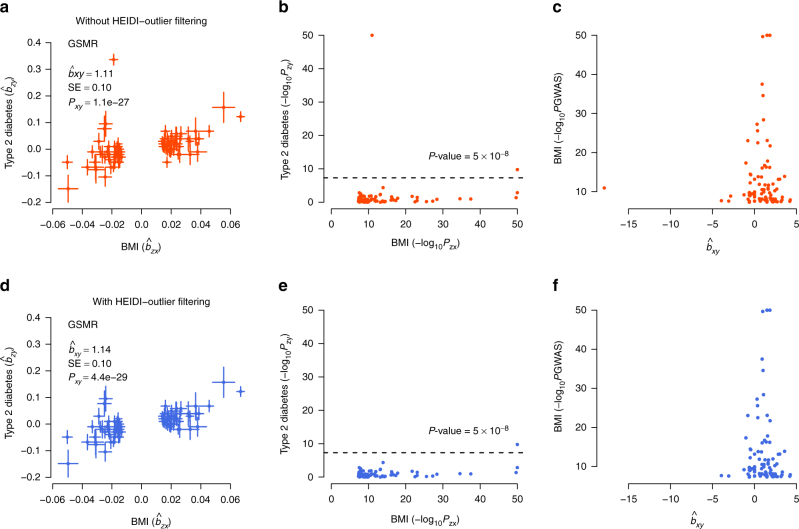
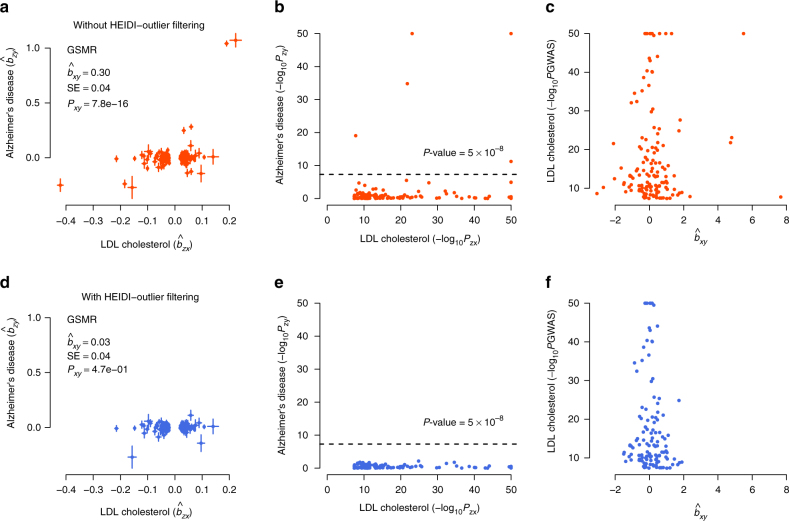
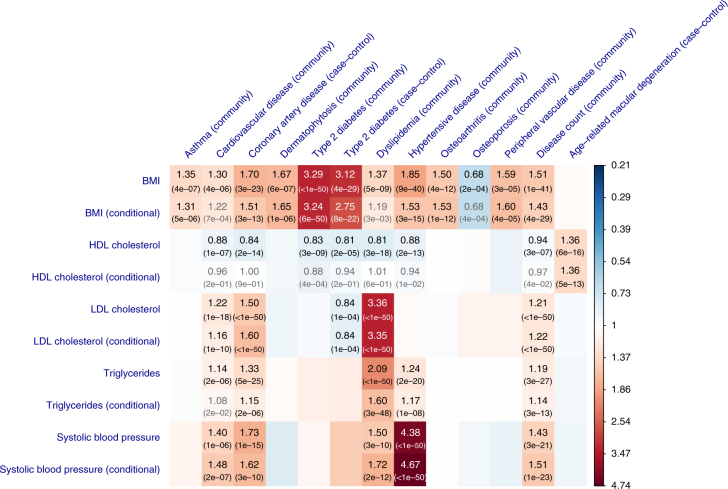
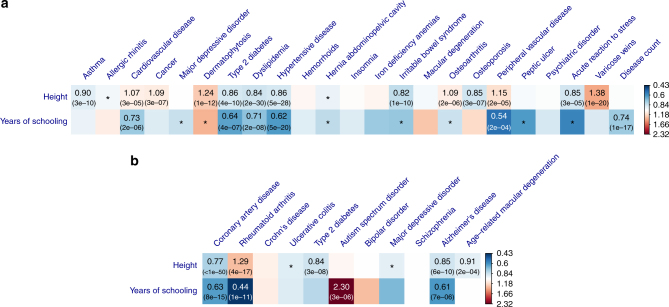
Health risk factors such as body mass index (BMI) and serum cholesterol are associated with many common diseases. It often remains unclear whether the risk factors are cause or consequence of disease, or whether the associations are the result of confounding. We develop and apply a method (called GSMR) that performs a multi-SNP Mendelian randomization analysis using summary-level data from genome-wide association studies to test the causal associations of BMI, waist-to-hip ratio, serum cholesterols, blood pressures, height, and years of schooling (EduYears) with common diseases (sample sizes of up to 405,072). We identify a number of causal associations including a protective effect of LDL-cholesterol against type-2 diabetes (T2D) that might explain the side effects of statins on T2D, a protective effect of EduYears against Alzheimer's disease, and bidirectional associations with opposite effects (e.g., higher BMI increases the risk of T2D but the effect of T2D on BMI is negative).


Conflict of interest statement

The authors declare no competing financial interests.

Figures

Fig. 1
Fig. 1
Leveraging multiple independent genetic instruments (z) to test for causality. Shown in panel a is a schematic example that if an exposure (x) has an effect on an outcome (y), any instruments (SNPs) causally associated with x will have an effect on y, and the effect of x on y (bxy) at any of the SNPs is expected to be identical. This is further illustrated in a toy example in panel b that under a causal model, for the SNPs associated with x, the estimated effect of z on y (b^zy) should be linearly proportional to the estimated effect of z on x (b^zx) and the ratio between the two is an estimate of the mediation effect of x on y, i.e., b^xy=b^zyb^zx
Fig. 2
Fig. 2
Putative causal associations between seven modifiable risk factors and common diseases. Shown are the results from GSMR analyses with disease data a from a meta-analysis of two community-based studies (GERA and UKB) and b from published independent case–control studies. Colors represent the effect sizes (as measured by odds ratios, ORs) of risk factors on diseases, red for risk effects and blue for protective effects. The significant effects after correcting for 231 tests (PGSMR < 2.2 × 10−4) are labeled with ORs (P-values). The nominally significant effects (PGSMR < 0.05) are labeled with “*”
Fig. 3
Fig. 3
GSMR analysis to test for the effect of BMI on T2D with and without filtering the pleiotropic outliers. Shown in a and b are the plots of effect sizes and association P-values of all the genetic instruments from GWAS for BMI vs. those for T2D. Shown in c is the plot of bxy vs. GWAS P-value of BMI at each genetic variant. Shown in d, e, and f are the plots for the instruments after the pleiotropic outliers being removed by the HEIDI-outlier approach (see Methods for details of the HEIDI-outlier approach). Error bars in a and d represent the standard errors. The dashed lines in b and e represent the GWAS threshold P-value of 5 × 10−8. The coordinates in b, c, e, and f are truncated at 50 for better graphic presentation
Fig. 4
Fig. 4
GSMR analysis to test for the effect of LDL-c on Alzheimer’s disease (AD) with and without pleiotropic outliers. Shown in a and b are the plots of effect sizes and association P-values of the original set of instruments from GWAS for LDL-c vs. those for AD. Shown in c is the plot of bxy vs. GWAS P-value of LDL-c at each genetic variant. Shown in d, e, and f are the plots for the instruments after the pleiotropic outliers being removed by the HEIDI-outlier approach (see Methods for details of the HEIDI-outlier approach). Error bars in a and d represent the standard errors. The dashed lines in b and e represent the GWAS threshold P-value of 5 × 10−8. The coordinates in b, c, e, and f are truncated at 50 for better graphic presentation
Fig. 5
Fig. 5
GSMR vs. conditional GSMR. Shown are the results from the GSMR analyses compared with those from the conditional GSMR analyses. In the conditional GSMR analysis, the effect size of each risk factor on disease was estimated conditioning on the other risk factors (see Methods for details of the conditional method). “Community”: disease GWAS data from a meta-analysis of the two community-based studies. “Case–control”: disease GWAS data from independent published case–control studies. In gray are the associations that do not pass the P-value threshold 2.2 × 10−4 in the conditional analysis
Fig. 6
Fig. 6
Effects of height and educational attainment on common diseases. Shown are the results from GSMR analyses with disease data a from a meta-analysis of the GERA and UKB studies and b from published independent case–control studies. Colors represent the effect sizes (as measured by odds ratios, ORs) of risk factors on diseases, red for risk effects and blue for protective effects. The significant effects after correcting for multiple testing (PGSMR < 7.6×10⁻⁴) are labeled with ORs (P-values). The nominally significant effects (PGSMR < 0.05) are labeled with “*”

References

    1. Knoops KT, et al. Mediterranean diet, lifestyle factors, and 10-year mortality in elderly European men and women: the HALE project. JAMA. 2004;292:1433–1439. doi: 10.1001/jama.292.12.1433. - DOI - PubMed
    1. Danaei G, et al. The preventable causes of death in the United States: comparative risk assessment of dietary, lifestyle, and metabolic risk factors. PLoS Med. 2009;6:e1000058. doi: 10.1371/journal.pmed.1000058. - DOI - PMC - PubMed
    1. Calle EE, Thun MJ, Petrelli JM, Rodriguez C, Heath CW., Jr. Body-mass index and mortality in a prospective cohort of U.S. adults. N. Engl. J. Med. 1999;341:1097–1105. doi: 10.1056/NEJM199910073411501. - DOI - PubMed
    1. Hu FB, et al. Diet, lifestyle, and the risk of type 2 diabetes mellitus in women. N. Engl. J. Med. 2001;345:790–797. doi: 10.1056/NEJMoa010492. - DOI - PubMed
    1. Kannel WB, Castelli WP, Gordon T, McNamara PM. Serum cholesterol, lipoproteins, and the risk of coronary heart disease. The Framingham study. Ann. Intern. Med. 1971;74:1–12. doi: 10.7326/0003-4819-74-1-1. - DOI - PubMed

Publication types