

Phosphorylation-induced conformation of β2-adrenoceptor related to arrestin recruitment revealed by NMR
- PMID: 29335412
- PMCID: PMC5768704
- DOI: 10.1038/s41467-017-02632-8
Phosphorylation-induced conformation of β2-adrenoceptor related to arrestin recruitment revealed by NMR
Abstract
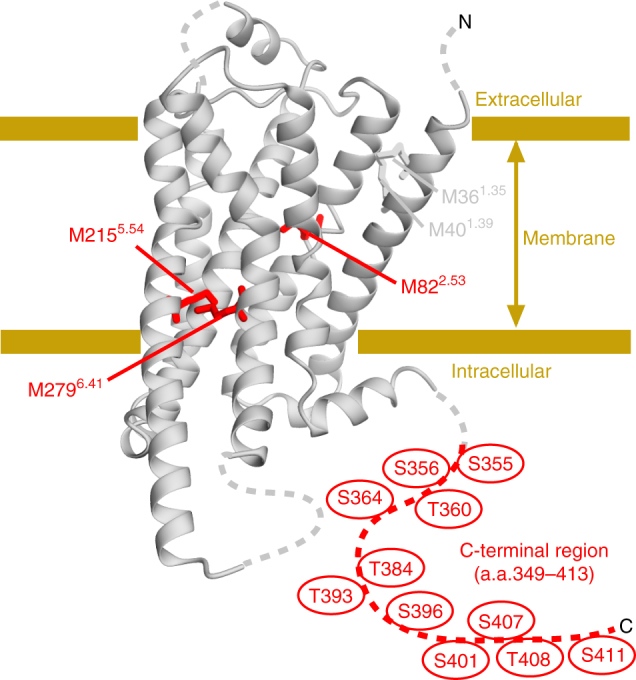
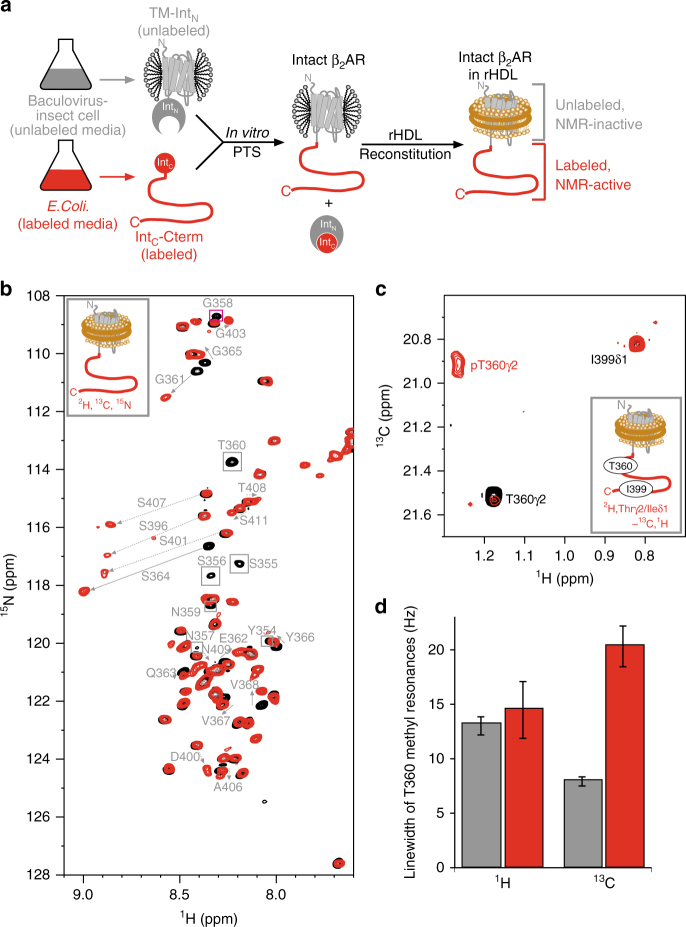
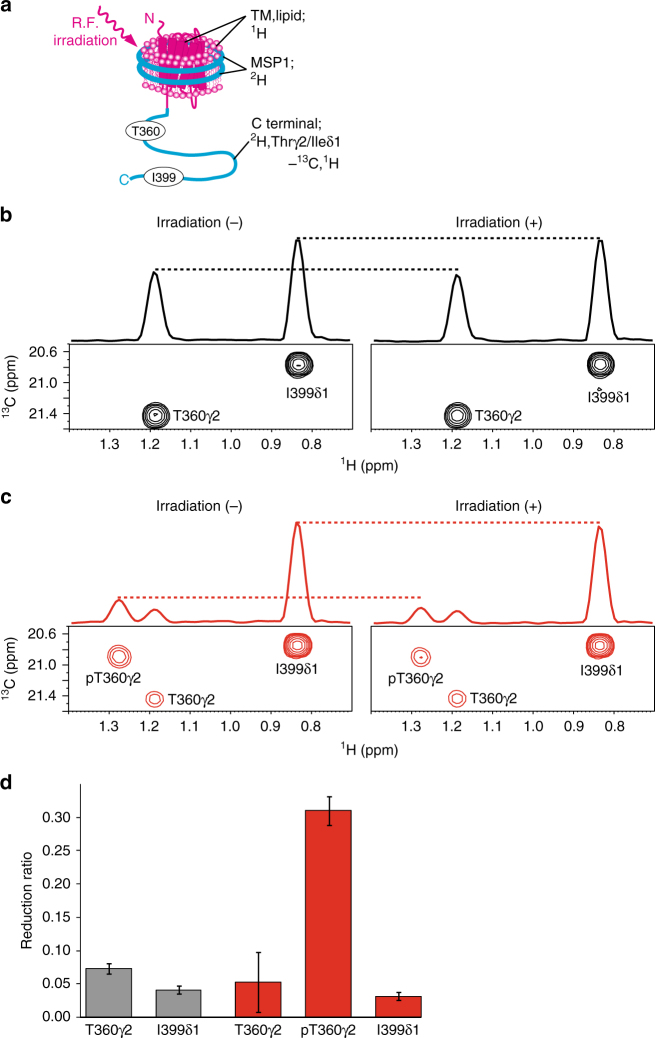
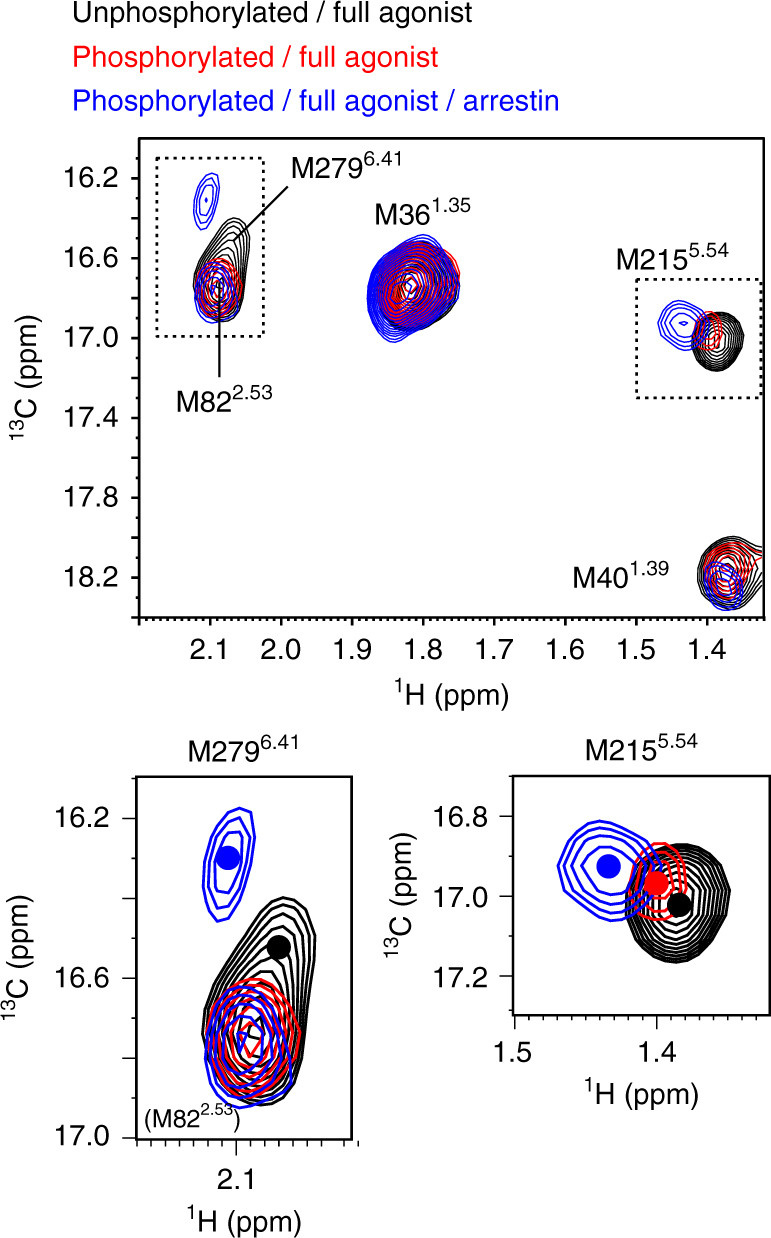
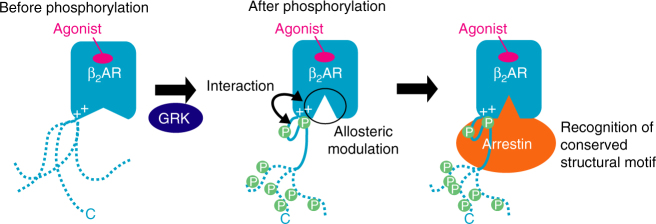
The C-terminal region of G-protein-coupled receptors (GPCRs), stimulated by agonist binding, is phosphorylated by GPCR kinases, and the phosphorylated GPCRs bind to arrestin, leading to the cellular responses. To understand the mechanism underlying the formation of the phosphorylated GPCR-arrestin complex, we performed NMR analyses of the phosphorylated β2-adrenoceptor (β2AR) and the phosphorylated β2AR-β-arrestin 1 complex, in the lipid bilayers of nanodisc. Here we show that the phosphorylated C-terminal region adheres to either the intracellular side of the transmembrane region or lipids, and that the phosphorylation of the C-terminal region allosterically alters the conformation around M2155.54 and M2796.41, located on transemembrane helices 5 and 6, respectively. In addition, we found that the conformation induced by the phosphorylation is similar to that corresponding to the β-arrestin-bound state. The phosphorylation-induced structures revealed in this study propose a conserved structural motif of GPCRs that enables β-arrestin to recognize dozens of GPCRs.
Conflict of interest statement
The authors declare no competing financial interests.
Figures

Similar articles
-
Sortase ligation enables homogeneous GPCR phosphorylation to reveal diversity in β-arrestin coupling.Proc Natl Acad Sci U S A. 2018 Apr 10;115(15):3834-3839. doi: 10.1073/pnas.1722336115. Epub 2018 Mar 26. Proc Natl Acad Sci U S A. 2018. PMID: 29581292 Free PMC article.
-
Allosteric activation of proto-oncogene kinase Src by GPCR-beta-arrestin complexes.J Biol Chem. 2020 Dec 4;295(49):16773-16784. doi: 10.1074/jbc.RA120.015400. Epub 2020 Sep 25. J Biol Chem. 2020. PMID: 32978252 Free PMC article.
-
Molecular Insights into Phosphorylation-Induced Allosteric Conformational Changes in a β2-Adrenergic Receptor.J Phys Chem B. 2022 Mar 10;126(9):1917-1932. doi: 10.1021/acs.jpcb.1c08610. Epub 2022 Feb 23. J Phys Chem B. 2022. PMID: 35196859
-
Phosphorylation of G Protein-Coupled Receptors: From the Barcode Hypothesis to the Flute Model.Mol Pharmacol. 2017 Sep;92(3):201-210. doi: 10.1124/mol.116.107839. Epub 2017 Feb 28. Mol Pharmacol. 2017. PMID: 28246190 Review.
-
Molecular mechanism of phosphorylation-dependent arrestin activation.Curr Opin Struct Biol. 2014 Dec;29:143-51. doi: 10.1016/j.sbi.2014.07.006. Epub 2014 Dec 5. Curr Opin Struct Biol. 2014. PMID: 25484000 Review.
Cited by
-
Structural biology of human GPCR drugs and endogenous ligands - insights from NMR spectroscopy.Methods. 2020 Aug 1;180:79-88. doi: 10.1016/j.ymeth.2020.08.008. Epub 2020 Sep 8. Methods. 2020. PMID: 32911074 Free PMC article. Review.
-
Capturing Peptide-GPCR Interactions and Their Dynamics.Molecules. 2020 Oct 15;25(20):4724. doi: 10.3390/molecules25204724. Molecules. 2020. PMID: 33076289 Free PMC article. Review.
-
Illuminating GPCR signaling mechanisms by NMR spectroscopy with stable-isotope labeled receptors.Curr Opin Pharmacol. 2023 Oct;72:102364. doi: 10.1016/j.coph.2023.102364. Epub 2023 Aug 21. Curr Opin Pharmacol. 2023. PMID: 37612173 Free PMC article. Review.
-
Control of G protein-coupled receptor function via membrane-interacting intrinsically disordered C-terminal domains.Proc Natl Acad Sci U S A. 2024 Jul 16;121(29):e2407744121. doi: 10.1073/pnas.2407744121. Epub 2024 Jul 10. Proc Natl Acad Sci U S A. 2024. PMID: 38985766 Free PMC article.
-
Lipids and Phosphorylation Conjointly Modulate Complex Formation of β2-Adrenergic Receptor and β-arrestin2.Front Cell Dev Biol. 2021 Dec 23;9:807913. doi: 10.3389/fcell.2021.807913. eCollection 2021. Front Cell Dev Biol. 2021. PMID: 35004696 Free PMC article.
References
Publication types
MeSH terms
Substances
LinkOut - more resources
Full Text Sources
Other Literature Sources
Molecular Biology Databases
Research Materials
