. 2018 Jan 15;8(1):725.
doi: 10.1038/s41598-017-18981-9.

SPARC expression is associated with hepatic injury in rodents and humans with non-alcoholic fatty liver disease

Affiliations

SPARC expression is associated with hepatic injury in rodents and humans with non-alcoholic fatty liver disease

Guillermo Mazzolini et al. Sci Rep. .

Abstract

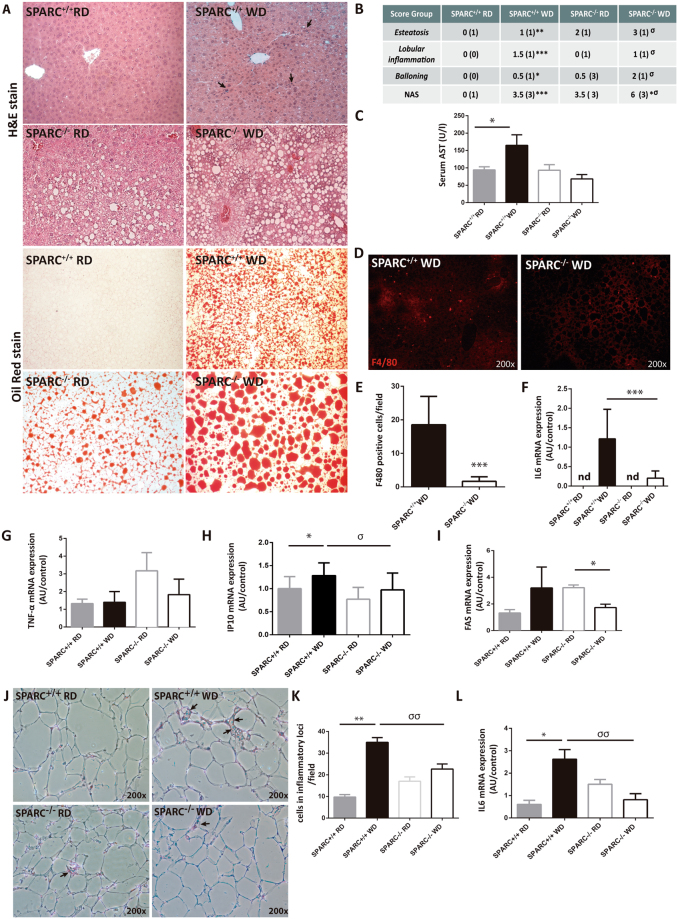
Mechanisms that control progression from simple steatosis to steato-hepatitis and fibrosis in patients with non-alcoholic fatty liver disease (NAFLD) are unknown. SPARC, a secreted matricellular protein, is over-expressed in the liver under chronic injury. Contribution of SPARC accumulation to disease severity is largely unknown in NAFLD. We assessed the hypothesis that SPARC is increased in livers with more necrosis and inflammation and could be associated with more fibrosis. qrt-PCR, immunohistochemistry, and ELISA were employed to localize and quantify changes in SPARC in 62 morbidly obese patients with NAFLD/NASH and in a mouse model of diet-induced-NASH. Results were correlated with the severity of NAFLD/NASH. In obese patients 2 subgroups were identified with either high SPARC expression (n = 16) or low SPARC expression (n = 46) in the liver, with a cutoff of 1.2 fold expression. High expression of SPARC paralleled hepatocellular damage and increased mRNA expression of pro-fibrogenic factors in the liver. In line with these findings, in the NASH animal model SPARC knockout mice were protected from inflammatory injury, and showed less inflammation and fibrosis. Hepatic SPARC expression is associated with liver injury and fibrogenic processes in NAFLD. SPARC has potential as preventive or therapeutic target in NAFLD patients.


Conflict of interest statement

The authors declare that they have no competing interests.

Figures

Figure 1
Figure 1
SPARC expression in patients with NAFLD induced liver injury. (A) Expression of SPARC was observed on protein (immunohistochemistry) in patients with NAFLD. Magnification 100× and 400×. Patients with high hepatic SPARC mRNA expression had significantly higher serum M30 levels (B) and nominally higher RIPK3 mRNA expression (C). Data are mean ± sem, *p < 0.05. Comparison between groups was performed with Mann-Whitney U Test. mRNA expressions of SPARC and RIPK3 were significantly correlated (D). Spearman rank test.
Figure 2
Figure 2
Pro-fibrogenic gene expression is increased in patients with NAFLD and high SPARC expression. NAFLD patients were grouped by hepatic SPARC mRNA expression. Patients with high SPARC expression had significantly higher collagen 1 alpha (A) and TGF-beta (B) mRNA expression in the liver. Data are mean ± sem, *p < 0.05. Comparison between groups was performed with Mann-Whitney U Test. mRNA expressions of both pro-fibronic genes were significantly correlated to SPARC expression (C,D). Spearman rank Test.
Figure 3
Figure 3
SPARC expression in adipose tissue and liver tissue are correlated. NAFLD patients were grouped by hepatic SPARC mRNA expression. Patients with high hepatic SPARC expression also had significantly higher SPARC mRNA expression in adipose tissue (A). Data are mean ± sem, **p < 0.01, Mann-Whitney U Test. mRNA expressions of SPARC in both sites were significantly correlated to each other (B). Spearman rank test.
Figure 4
Figure 4
SPARC expression in murine dietary NASH model. (A) Hepatic SPARC expression detected by qPCR in the high fat diet (HF) model of NASH in mice. After 12 (upper panel) and 20 (lower panel) weeks of western diet (WD), SPARC expression was significantly induced compared with mice fed with regular chow (RD). (B) Body and liver weight increment after 20 weeks. Data are means ± SEM. *, compared between WD and RD diet; σ, compared between SPARC−/− and SPARC+/+ fed with WD diet. *p < 0.05, **p < 0.01, σσσp < 0.001; Kruskal-Wallis test. (C) Visceral adipose tissue deposition (black arrow) and appearance of the liver in SPARC−/− and SPARC+/+ fed with WD or RD diet for 20 weeks.
Figure 5
Figure 5
Effect of SPARC deficiency in mice fed with a non-alcoholic steatohepatitis-inducing diet. (A) Hematoxylin/eosin (H/E) and oil red staining of liver sections from SPARC+/+ mice and SPARC−/− mice after feeding with WD or RD diet for 20 weeks. H/E staining demonstrated more inflammation and necrosis in WD-fed SPARC+/+ mice compare with WD-fed SPARC−/− mice. Arrows indicate inflammatory cell infiltration. WD diet increased fat deposition visualized by oil red staining in SPARC+/+ and SPARC−/−mice. WD-fed SPARC−/− exhibited enlarged lipid droplets compared to SPARC+/+ with WD. Image magnification: 200×. (B) NAFLD activity score (NAS) showing more steatosis, inflammation and ballooning in SPARC+/+ mice in comparison with SPARC−/− mice. n = 6–8 mice per group. Data are presented as median and range. *Compared WD vs RD diet in both SPARC+/+ and SPARC−/− mice; σcompared WD-fed SPARC+/+ versus WD-fed SPARC−/− mice. *p < 0.05, ***p < 0.001; σp < 0.05; σσp < 0.01, σσσp < 0.001; Kruskal-Wallis test with Dunn’s post test C) Serum AST levels. Data are mean ± sem. *p < 0.05, Kruskal-Wallis test with Dunn’s post test. n = 6–8 mice per group. D) Analysis of hepatic F4/80 positive cell infiltration by immunofluorescence in liver sections of WD diet-fed SPARC+/+ and SPARC−/− mice. Magnification: 200× (E) F4/80 positive cells quantification. Ten random fields were analyzed for each group (x200 magnification), n = 4 mice per group. ***p < 0.001, Mann-Whitney T test. (F) Hepatic IL6 mRNA expression assessed by qrt-PCR ***p < 0.001, Mann-Whitney T test. nd, non-detectable amplification (GI) Hepatic mRNA expression of tumor necrosis factor-α (TNF-α), IP-10, and FAS/CD95 in response to WD diet in both SPARC−/− mice and SPARC+/+ mice compared with animals fed with RD. (J) Hematoxylin/eosin (H/E) staining of adipose tissue sections from SPARC+/+ and SPARC−/− mice after feeding with WD or RD diet for 20 weeks. Magnification: x200. (K) Inflammatory cell quantification. Ten random fields were analyzed for each group (x200 magnification). (L) Adipose IL6 mRNA expression assessed by qPCR. *Compared WD vs RD diet in both SPARC+/+ and SPARC−/− mice; σcompared WD-fed SPARC+/+ versus WD-fed SPARC−/− mice. * or σp < 0.05, ** or σσp < 0.01, Kruskall-Wallis test, with Dunn’s post test.
Figure 6
Figure 6
Fibrosis markers decrease in SPARC−/− mice fed with WD diet. (A,B) Hepatic expression of collagen alpha I, and α-SMA in response to WD feeding compared with controls. *p < 0.05, ***p < 0.001; σσp < 0.01; Kruskal-Wallis test with Dunn’s post test. n = 6–8 mice per group. (C) Immunohistochemistry for hepatic α-SMA. Arrowheads indicate the internal positive control-stained area (portal myofibroblast). Arrows indicate α-SMA positive cells in the perisinusoidal zone. (D) α-SMA positive cells quantification. n = 6 mice per group. Twenty random fields were analyzed for each group (x400 magnification) ***p < 0.001, Mann-Whitney U test. (E) Representative images of Sirius red staining of liver sections from SPARC+/+ and SPARC−/− mice after feeding WD diet. Arrows indicate collagen deposition. Magnification: 200 × B. (F) Quantification of Sirius red-positive areas using image analysis. n = 6–8 mice per group. **p < 0.01, Kruskal-Wallis test with Dunn’s post test.

References

    1. Rinella ME, Sanyal AJ. NAFLD in 2014: Genetics, diagnostics and therapeutic advances in NAFLD. Nat Rev Gastroenterol Hepatol. 2015;12:65–66. doi: 10.1038/nrgastro.2014.232. - DOI - PMC - PubMed
    1. Angulo, P., Keach, J. C., Batts, K. P. & Lindor, K. D. Independent predictors of liver fibrosis in patients with nonalcoholic steatohepatitis. Hepatology30, 1356–1362, S0270913999005017 (1999). - PubMed
    1. Lazo M, Clark JM. The epidemiology of nonalcoholic fatty liver disease: a global perspective. Semin Liver Dis. 2008;28:339–350. doi: 10.1055/s-0028-1091978. - DOI - PubMed
    1. Kleiner DE, et al. Design and validation of a histological scoring system for nonalcoholic fatty liver disease. Hepatology. 2005;41:1313–1321. doi: 10.1002/hep.20701. - DOI - PubMed
    1. Abenavoli L, Peta V. Role of adipokines and cytokines in non-alcoholic fatty liver disease. Reviews on recent clinical trials. 2014;9:134–140. doi: 10.2174/1574887109666141216102458. - DOI - PubMed

Publication types