

Characterizing the dynamics underlying global spread of epidemics
- PMID: 29335536
- PMCID: PMC5768765
- DOI: 10.1038/s41467-017-02344-z
Characterizing the dynamics underlying global spread of epidemics
Abstract
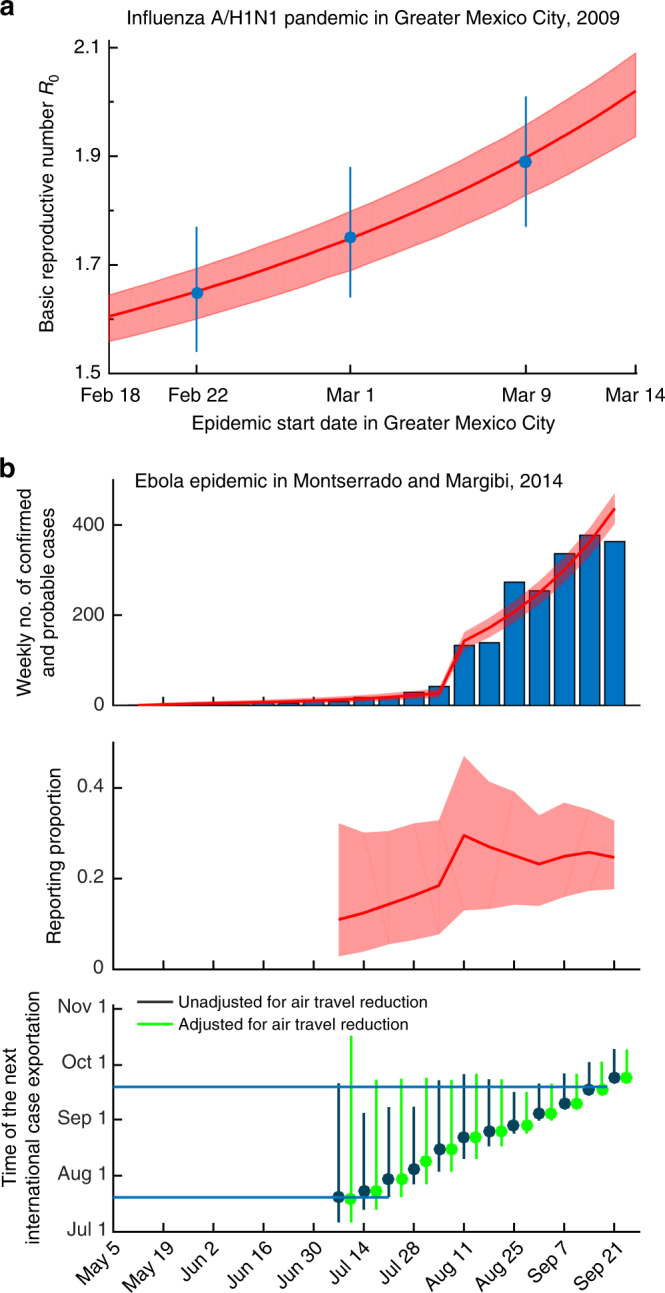
Over the past few decades, global metapopulation epidemic simulations built with worldwide air-transportation data have been the main tool for studying how epidemics spread from the origin to other parts of the world (e.g., for pandemic influenza, SARS, and Ebola). However, it remains unclear how disease epidemiology and the air-transportation network structure determine epidemic arrivals for different populations around the globe. Here, we fill this knowledge gap by developing and validating an analytical framework that requires only basic analytics from stochastic processes. We apply this framework retrospectively to the 2009 influenza pandemic and 2014 Ebola epidemic to show that key epidemic parameters could be robustly estimated in real-time from public data on local and global spread at very low computational cost. Our framework not only elucidates the dynamics underlying global spread of epidemics but also advances our capability in nowcasting and forecasting epidemics.
Conflict of interest statement
The authors declare no competing financial interests.
Figures
Similar articles
-
Forecasting efforts from prior epidemics and COVID-19 predictions.Eur J Epidemiol. 2020 Aug;35(8):727-729. doi: 10.1007/s10654-020-00661-0. Epub 2020 Jul 17. Eur J Epidemiol. 2020. PMID: 32676971 Free PMC article.
-
Forecasting Epidemics Through Nonparametric Estimation of Time-Dependent Transmission Rates Using the SEIR Model.Bull Math Biol. 2019 Nov;81(11):4343-4365. doi: 10.1007/s11538-017-0284-3. Epub 2017 May 2. Bull Math Biol. 2019. PMID: 28466232
-
Delaying the international spread of pandemic influenza.PLoS Med. 2006 Jun;3(6):e212. doi: 10.1371/journal.pmed.0030212. Epub 2006 May 2. PLoS Med. 2006. PMID: 16640458 Free PMC article.
-
AIDS, Avian flu, SARS, MERS, Ebola, Zika… what next?Vaccine. 2017 Aug 16;35(35 Pt A):4470-4474. doi: 10.1016/j.vaccine.2017.04.082. Epub 2017 Jun 19. Vaccine. 2017. PMID: 28633891 Free PMC article. Review.
-
Ebola Virus Disease: A Review of Its Past and Present.Anesth Analg. 2015 Sep;121(3):798-809. doi: 10.1213/ANE.0000000000000866. Anesth Analg. 2015. PMID: 26287303 Review.
Cited by
-
Nowcasting and forecasting the potential domestic and international spread of the 2019-nCoV outbreak originating in Wuhan, China: a modelling study.Lancet. 2020 Feb 29;395(10225):689-697. doi: 10.1016/S0140-6736(20)30260-9. Epub 2020 Jan 31. Lancet. 2020. PMID: 32014114 Free PMC article.
-
Epidemiological analysis of the Kaohsiung city strategy for dengue fever quarantine and epidemic prevention.BMC Infect Dis. 2020 May 15;20(1):347. doi: 10.1186/s12879-020-4942-y. BMC Infect Dis. 2020. PMID: 32414340 Free PMC article.
-
Modelling the geographical spread of HIV among MSM in Guangdong, China: a metapopulation model considering the impact of pre-exposure prophylaxis.Philos Trans A Math Phys Eng Sci. 2022 Jan 10;380(2214):20210126. doi: 10.1098/rsta.2021.0126. Epub 2021 Nov 22. Philos Trans A Math Phys Eng Sci. 2022. PMID: 34802265 Free PMC article.
-
Cluster-Based Analysis of Infectious Disease Occurrences Using Tensor Decomposition: A Case Study of South Korea.Int J Environ Res Public Health. 2020 Jul 6;17(13):4872. doi: 10.3390/ijerph17134872. Int J Environ Res Public Health. 2020. PMID: 32640742 Free PMC article.
-
What Influence Could the Acceptance of Visitors Cause on the Epidemic Dynamics of a Reinfectious Disease?: A Mathematical Model.Acta Biotheor. 2024 Feb 25;72(1):3. doi: 10.1007/s10441-024-09478-w. Acta Biotheor. 2024. PMID: 38402514 Free PMC article.
References
-
- Rvachev LA, Longini IM. A mathematical model for the global spread of influenza. Math. Biosci. 1985;75:3–22. doi: 10.1016/0025-5564(85)90064-1. - DOI
Publication types
MeSH terms
Grants and funding
LinkOut - more resources
Full Text Sources
Other Literature Sources
Medical
Miscellaneous
