. 2018 Feb;50(2):219-228.
doi: 10.1038/s41588-017-0026-3. Epub 2018 Jan 15.

Compartmentalized activities of the pyruvate dehydrogenase complex sustain lipogenesis in prostate cancer

Affiliations

Compartmentalized activities of the pyruvate dehydrogenase complex sustain lipogenesis in prostate cancer

Jingjing Chen et al. Nat Genet. 2018 Feb.

Erratum in

Abstract

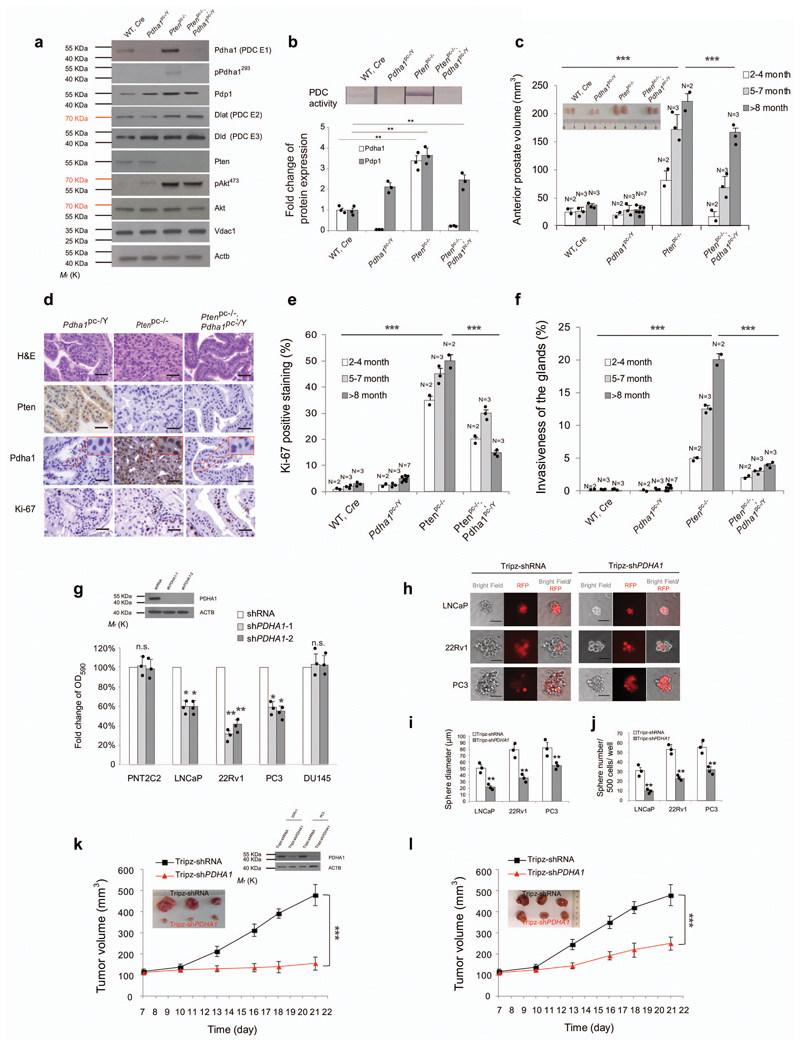
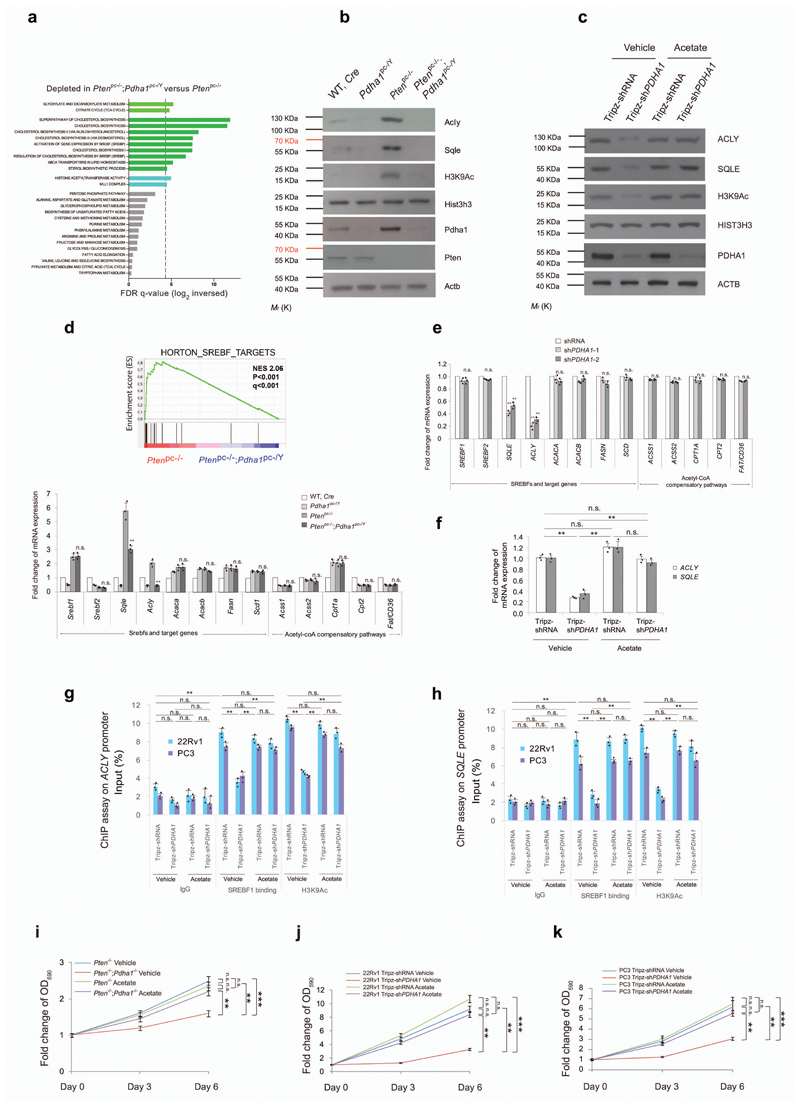
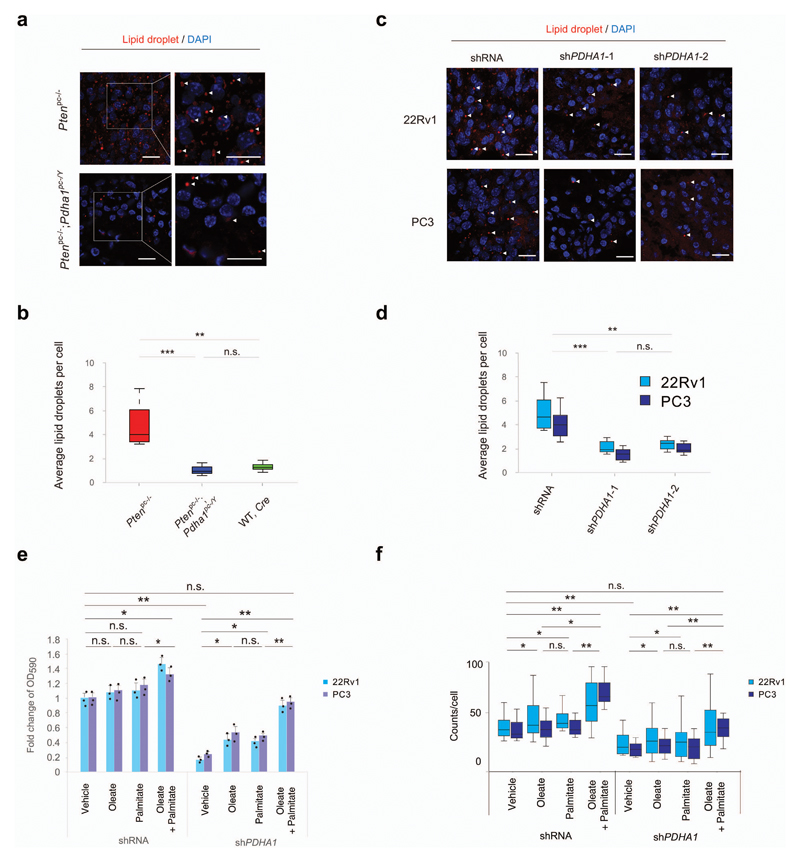
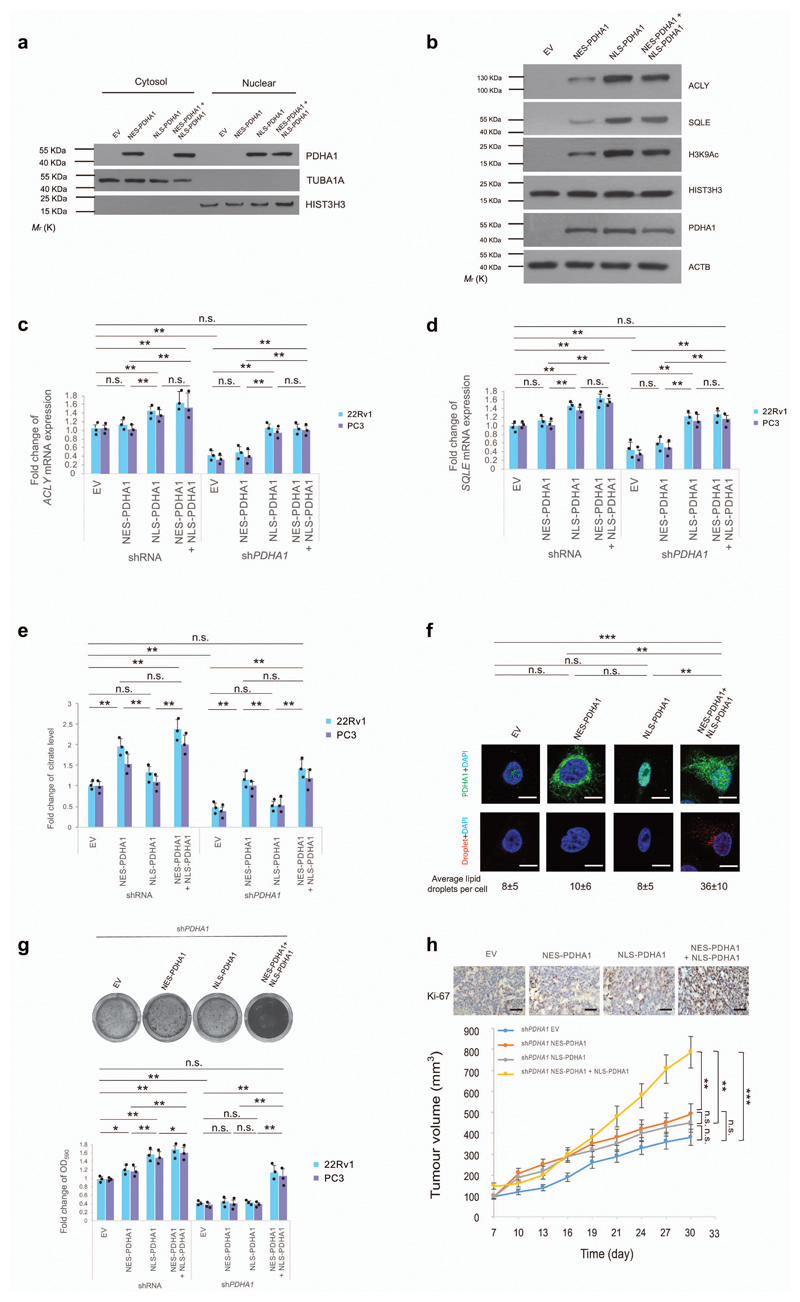
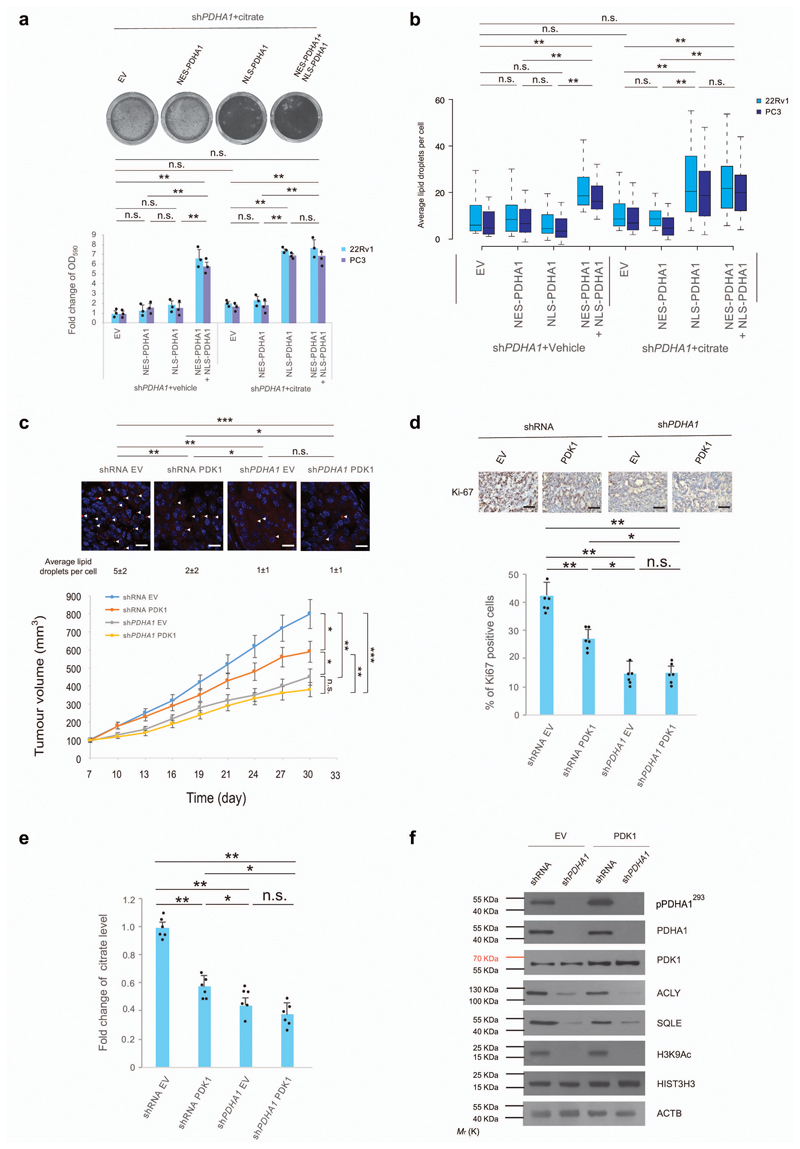
The mechanisms by which mitochondrial metabolism supports cancer anabolism remain unclear. Here, we found that genetic and pharmacological inactivation of pyruvate dehydrogenase A1 (PDHA1), a subunit of the pyruvate dehydrogenase complex (PDC), inhibits prostate cancer development in mouse and human xenograft tumor models by affecting lipid biosynthesis. Mechanistically, we show that in prostate cancer, PDC localizes in both the mitochondria and the nucleus. Whereas nuclear PDC controls the expression of sterol regulatory element-binding transcription factor (SREBF)-target genes by mediating histone acetylation, mitochondrial PDC provides cytosolic citrate for lipid synthesis in a coordinated manner, thereby sustaining anabolism. Additionally, we found that PDHA1 and the PDC activator pyruvate dehydrogenase phosphatase 1 (PDP1) are frequently amplified and overexpressed at both the gene and protein levels in prostate tumors. Together, these findings demonstrate that both mitochondrial and nuclear PDC sustain prostate tumorigenesis by controlling lipid biosynthesis, thus suggesting this complex as a potential target for cancer therapy.


Conflict of interest statement

Competing interests

The authors declare no competing financial interests.

Figures

Figure 1
Figure 1. Pdha1 knockout induces tumour suppression in mice and human prostate tumours.
(a) Western blot analysis of indicated proteins in wild type, Pdha1pc-/Y, Ptenpc-/- and Ptenpc-/-; Pdha1pc-/Y prostates and tumours (n=3, independent prostate samples). Uncropped images are in Supplementary Figure 12. (b) Upper panel, PDC activity measurement in wild type, Pdha1pc-/Y, Ptenpc-/- and Ptenpc-/-; Pdha1pc-/Y prostates and tumours (n=3, independent prostate samples). Lower panel, Quantification of indicated proteins normalized to wild type tissues in indicated prostate tumours in (a) (n=3, independent prostate samples). (c) Comparison of anterior prostate (AP) lobe volumes (mm3, 2 independent lobes per animal are presented) from male of indicated ages and genotypes between wild type, Pdha1pc-/Y, Ptenpc-/- and Ptenpc-/-; Pdha1pc-/Y prostate and tumours (N, the number of mice of indicated ages). Inset is the representative image of anterior prostate lobes in the panel. (d) Representative micrographs in histopathological analysis (haematoxylin/eosin staining and indicated proteins) of anterior prostates (AP) in Pdha1pc-/Y, Ptenpc-/- and Ptenpc-/-; Pdha1pc-/Y prostate tissues from 12 weeks old male mice (n=3) (Scale bar represents 50 μm, insets are regions shown in higher magnification, see also Supplementary Fig. 1c for all the genotypes and images of lower magnification). (e,f) Quantification of the percentage of Ki-67 positive cells (e) and invasive prostate glands (f) in prostates from mice of indicated genotypes at different ages (N, number of mice of indicated ages). (g) Relative cell number quantification by crystal violet staining in the indicated prostate cancer cell lines infected with shPDHA1 or scramble control. Data is normalized to shRNA control. PDHA1 inhibition validated by western blot analysis using two different shPDHA1 was shown in the inset of the panel. Uncropped images are in Supplementary Figure 12. (n=3, independent cell cultures). (h) Spheroid Formation Assays in LNCaP, 22Rv1 and PC3 cells infected with doxycycline-induced Tripz-shPDHA1 or scramble control (n=3, independent cell cultures). Scale bar represents 50 µm. (i,j) Quantification of spheroid diameter (i) and spheroid number per 500 cells (j) in LNCaP, 22Rv1 and PC3 cells infected with doxycycline-induced Tripz-shPDHA1 or scramble Tripz-shRNA control (n=3, independent cell cultures). (k,l) Evaluation of tumour formation in xenotransplantation experiments of 22Rv1 (k) and PC3 (l) cells infected with indicated shPDHA1 or scramble shRNA control. The knockdown of PDHA1 in 22Rv1 and PC3 xenograft tumours is validated by western blot in the inset of panel (k). Uncropped images are in Supplementary Figure 12. (n=6 animals; 12 independent tumour samples). Error bars indicate s.e.m. **P < 0.01; ***P < 0.001. n.s, not significant.
Figure 2
Figure 2. Pdha1 inactivation induces tumour suppression by down-regulating lipogenic genes.
(a) Gene expression profile analysis based on metabolic pathway datasets (GOCC, Gene Ontology Cellular Component; KEGG, Kyoto Encyclopaedia of Genes and Genomes; GOBO, Gene expression-based Outcome; GOMF, Gene Ontology Molecular Function; HumanCyc; Reactome) in Ptenpc-/-; Pdha1pc-/Y tumours versus Ptenpc-/- tumours. Dotted line indicates P=0.05 (n=3). (b) Western blot analysis of indicated proteins in wild type, Pdha1pc-/Y, Ptenpc-/- and Ptenpc-/-; Pdha1pc-/Y prostates and tumours. Uncropped images are in Supplementary Figure 12. (n=3, independent prostate samples). (c) Western blot analysis of indicated proteins in 22Rv1 cells infected with doxycycline-induced Tripz-shPDHA1 or scramble control and treated with 100 μM acetate or vehicle over a 6-day period. Uncropped images are in Supplementary Figure 12. (n=3, independent cell cultures). (d) Upper panel, GSEA of SREBF target genes in Ptenpc-/-; Pdha1pc-/Y versus Ptenpc-/- prostate tumours. Normalized enriched scores (NES) are presented. Data are mean ± standard deviation (s.d.). Lower panel, quantitative real time-PCR analysis of mRNA expression of indicated SREBFs and target genes and genes in acetyl CoA compensatory pathways in mouse prostate and tumours the indicated genotypes (n=3). (e) Quantitative real time-PCR analysis of mRNA expression of indicated SREBFs and target genes and genes in acetyl coA compensatory pathways in 22Rv1 cells infected with shPDHA1 and scramble shRNA control (n=3, independent cell cultures). (f) Quantitative RT-PCR analysis of ACLY and SQLE in 22Rv1 cells infected with doxycycline-induced Tripz-shPDHA1 or scramble control and treated with acetate (100 µM) or vehicle for 6 days (n=3, independent cell cultures). (g,h) Chromatin immunoprecipitation analysis showing the binding of SREBF1 and H3K9Ac on the promoters of ACLY (g) and SQLE (h) in 22Rv1 and PC3 cells infected with doxycycline-induced Tripz-shPDHA1 or scramble control and treated with 100 μM acetate or vehicle over a 6-day period (n=3, independent cell cultures). (i-k) Relative cell number quantification by crystal violet staining of Pten-/- and Pten-/-;Pdha1-/Y MEFs (i) and human cancer cells 22Rv1 and PC3 cells infected with doxycycline-induced Tripz-shPDHA1 or scramble control. (j,k) and treated with acetate (100 µM) or vehicle over a 6-day period (n=3, independent cell cultures). Error bars indicate s.e.m. *P < 0.05; **P < 0.01; ***P < 0.001. n.s, not significant.
Figure 3
Figure 3. Pdha1 knockdown induces tumour suppression by abrogating lipogenesis.
(a,b) Representative confocal images (a) and quantification of average lipid droplets per cell (Lipidtox, red) (b) in the indicated genotypes in Ptenpc-/-; Pdha1pc-/Y versus Ptenpc-/- prostate tumours. DAPI, blue. (n=3 mice, Scale bar: 20 µm, 1 tumour per mouse, 5 fields acquired). (c,d) Representative confocal images (c) and quantification of average lipid droplets per cell (Lipidtox, red) (d) in 22Rv1 and PC3 shPDHA1 and shRNA xenograft tumours. DAPI, blue. (n=3 mice, Scale bar represents 20 µm, 1 tumour per mouse, 5 fields acquired). (e,f) Relative cell number quantification by crystal violet staining (e) and quantification of lipid droplets by average lipid droplet per cell (f) in 22Rv1 and PC3 cells infected with a shPDHA1 and scramble shRNA control and treated with exogenous fatty acids in fatty acid free media; oleate (25 μM), palmitate (25 μM) or a combination of these two were used(n=3, independent cell cultures). Error bars indicate s.e.m. *P < 0.05; **P < 0.01; ***P < 0.001. n.s, not significant.
Figure 4
Figure 4. Nuclear PDC regulates the expression of lipid biosynthesis genes independently of mitochondrial PDC.
(a) Western blot analysis of indicated proteins in nuclear and cytoplasmic fractions of shPDHA1 22Rv1 cells infected with NES-PDHA1 and NLS-PDHA1 alone or in combination. Uncropped images are in Supplementary Figure 13. (n=3, independent cell cultures). (b) Western blot analysis of indicated proteins in shPDHA1 22Rv1 cells infected NES-PDHA1 and NLS-PDHA1 alone or in combination (see full panel in Supplementary Fig. 5b). Uncropped images are in Supplementary Figure 13. (n=3, independent cell cultures). (c-e) Quantitative real-time PCR analysis of mRNA expression for ACLY (c) and SQLE (d) and determination of citrate levels (e) in shRNA control and shPDHA1 22Rv1 and PC3 infected with NES-PDHA1, NLS-PDHA1 alone or in combination (n=3, independent cell cultures). (f) Representative confocal images and quantification of lipid droplets (average lipid droplets per cell) in shPDHA1 22Rv1 infected with NES-PDHA1, NLS-PDHA1 alone or in combination (n=3, independent cell cultures, Scale bar represents 10 µm, 5 fields acquired for each group). (g) Upper panel, representative images of crystal violet staining of shPDHA1 22Rv1 infected with infected with NES-PDHA1, NLS-PDHA1 alone or in combination (n=3, independent cell cultures). Lower panel, relative cell number quantification by crystal violet staining in shRNA control and shPDHA1 22Rv1 and PC3 infected with NES-PDHA1, NLS-PDHA1 alone or in combination (n=3, independent cell cultures). (h) Upper panel, representative micrographs in histopathological analysis of Ki-67 of these xenograft tumours. Lower panel, evaluation of tumour formation in xenotransplantation experiments of shPDHA1 22Rv1 infected with NES-PDHA1, NLS-PDHA1 alone or in combination (n=6 animals; 12 injections, Scale bar represents 50 µm, also see Supplementary Fig. 7d for the full panel). Error bars indicate s.e.m. *P < 0.05; **P < 0.01; ***P < 0.001. n.s, not significant.
Figure 5
Figure 5. Nuclear PDC regulates fatty acid synthesis in presence of mitochondrial citrate.
(a,b) Relative cell number quantification by crystal violet (a, also see full panel in Supplementary Fig. 8a) and quantification by confocal microscopy of average lipid droplets per cell (b) in shPDHA1 22Rv1 and PC3 cells infected with NES-PDHA1, NLS-PDHA1 alone or in combination and treated with citrate (100 µM) or vehicle for 6 days (n=3, independent cell cultures). (c) Upper panel, Representative confocal images, and quantification of average lipid droplets per cell, in xenograft tumours from shRNA control and shPDHA1 22Rv1 cells infected with PDK1 or empty vector. Lower panel, Evaluation of tumour formation in xenotransplantation experiments in shRNA control and shPDHA1 22Rv1 cells infected with PDK1 or empty vector (n=6 animals; 12 injections, 5 fields acquired for each group and Scale Bar represents 20 μm). (d) Upper panel, representative immune-histochemistry micrographs for Ki-67 staining in tumours of the indicated genotypes. (n=6 animals; 12 injections, 5 fields acquired for each group and scale bar represents 50 μm). Lower panel, quantification of the percentage of Ki-67 positive cells in different tumour genotypes (n=6 animals; 12 injections, 5 fields acquired for each group). (e,f) Determination of citrate levels (e) and western blot analysis of indicated proteins (f) in xenograft tumours from shRNA control and shPDHA1 22Rv1 cells infected with PDK1 or empty vector. Uncropped images are in Supplementary Figure 13. (n=6, independent tumour samples). Error bars indicate s.e.m. *P < 0.05; **P < 0.01; ***P < 0.001. n.s, not significant.

Comment in

References

    1. Zong WX, Rabinowitz JD, White E. Mitochondria and Cancer. Mol Cell. 2016;61:667–676. doi: 10.1016/j.molcel.2016.02.011. - DOI - PMC - PubMed
    1. LeBleu VS, et al. PGC-1alpha mediates mitochondrial biogenesis and oxidative phosphorylation in cancer cells to promote metastasis. Nat Cell Biol. 2014;16:992–1003. doi: 10.1038/ncb3039. 1001–1015. - DOI - PMC - PubMed
    1. Marin-Valencia I, et al. Analysis of tumor metabolism reveals mitochondrial glucose oxidation in genetically diverse human glioblastomas in the mouse brain in vivo. Cell Metab. 2012;15:827–837. doi: 10.1016/j.cmet.2012.05.001. - DOI - PMC - PubMed
    1. Vazquez F, et al. PGC1alpha expression defines a subset of human melanoma tumors with increased mitochondrial capacity and resistance to oxidative stress. Cancer Cell. 2013;23:287–301. doi: 10.1016/j.ccr.2012.11.020. - DOI - PMC - PubMed
    1. Viale A, et al. Oncogene ablation-resistant pancreatic cancer cells depend on mitochondrial function. Nature. 2014;514:628–632. doi: 10.1038/nature13611. - DOI - PMC - PubMed

Publication types

MeSH terms

Substances