. 2018 Feb;50(2):206-218.
doi: 10.1038/s41588-017-0027-2. Epub 2018 Jan 15.

An aberrant SREBP-dependent lipogenic program promotes metastatic prostate cancer

Affiliations

An aberrant SREBP-dependent lipogenic program promotes metastatic prostate cancer

Ming Chen et al. Nat Genet. 2018 Feb.

Abstract

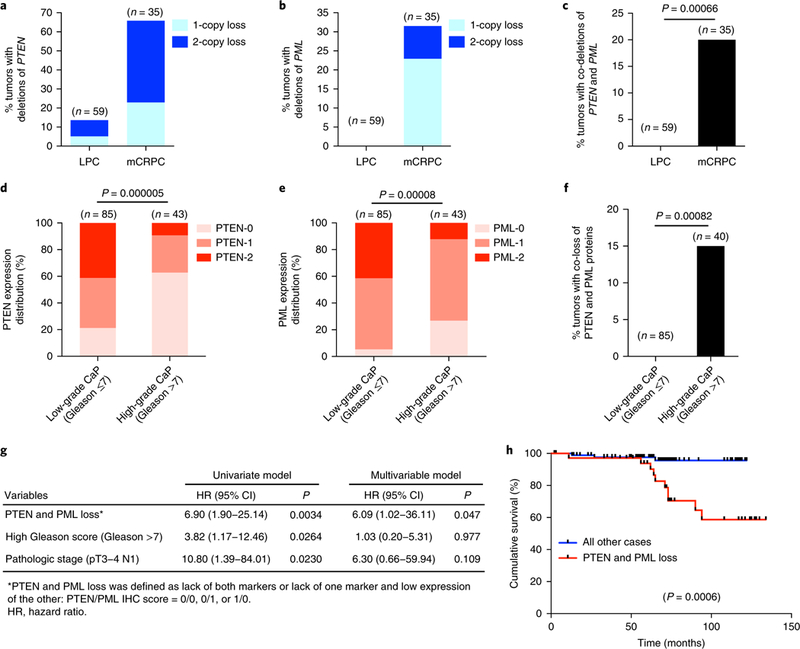
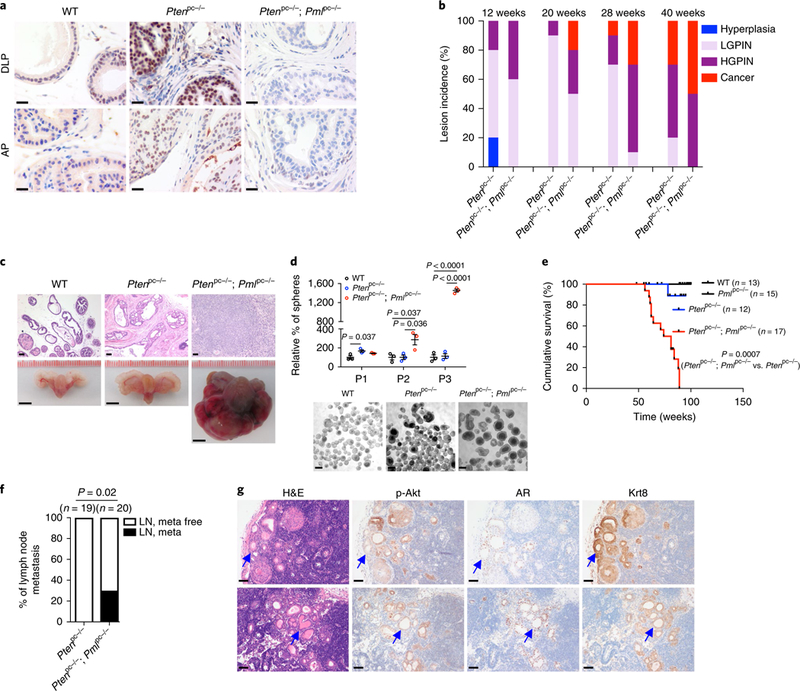
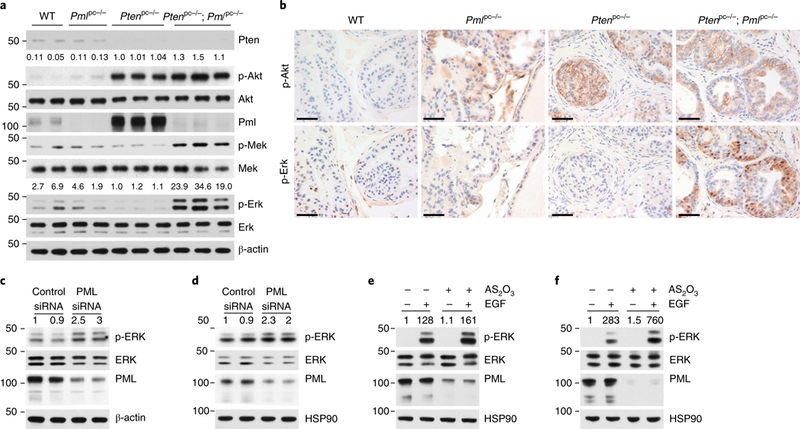
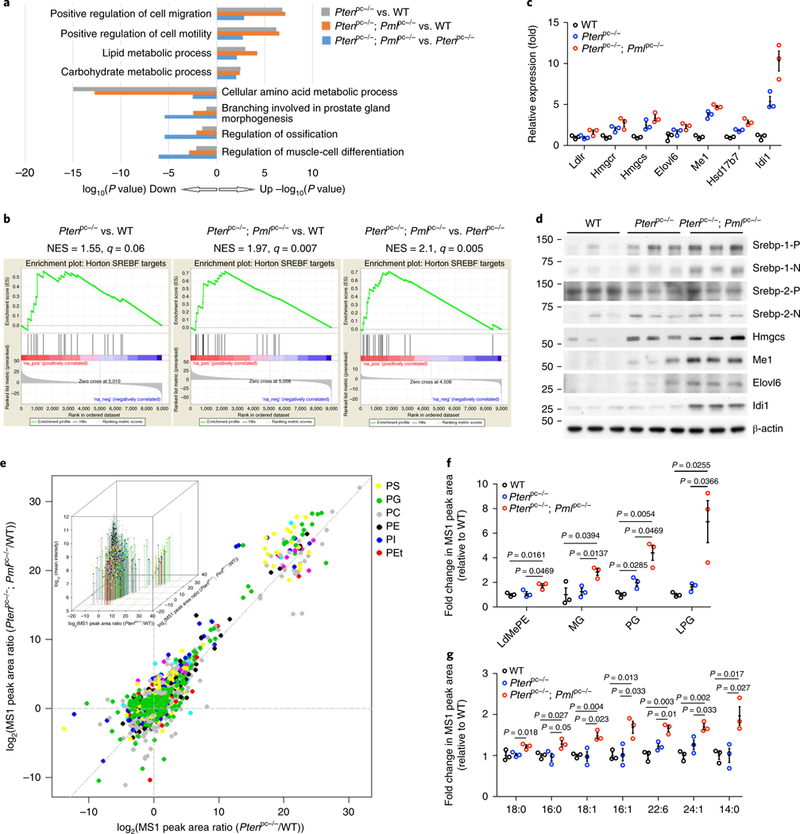
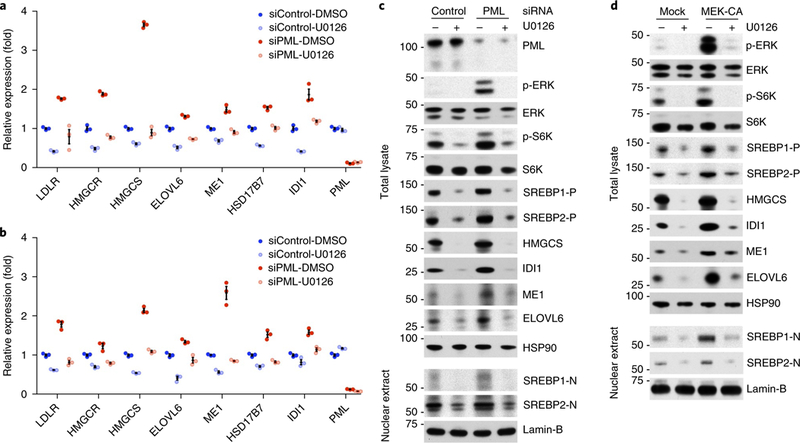
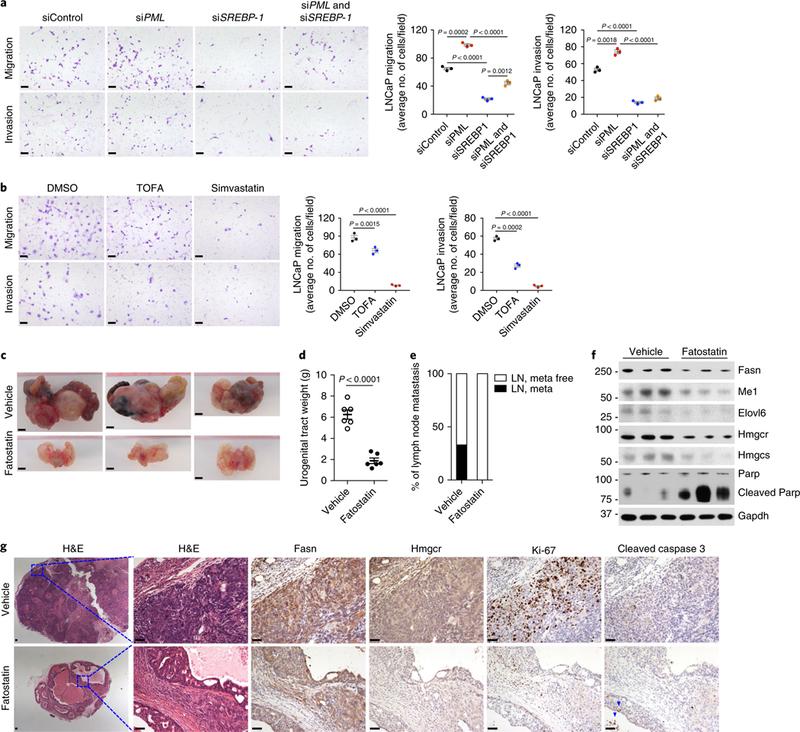
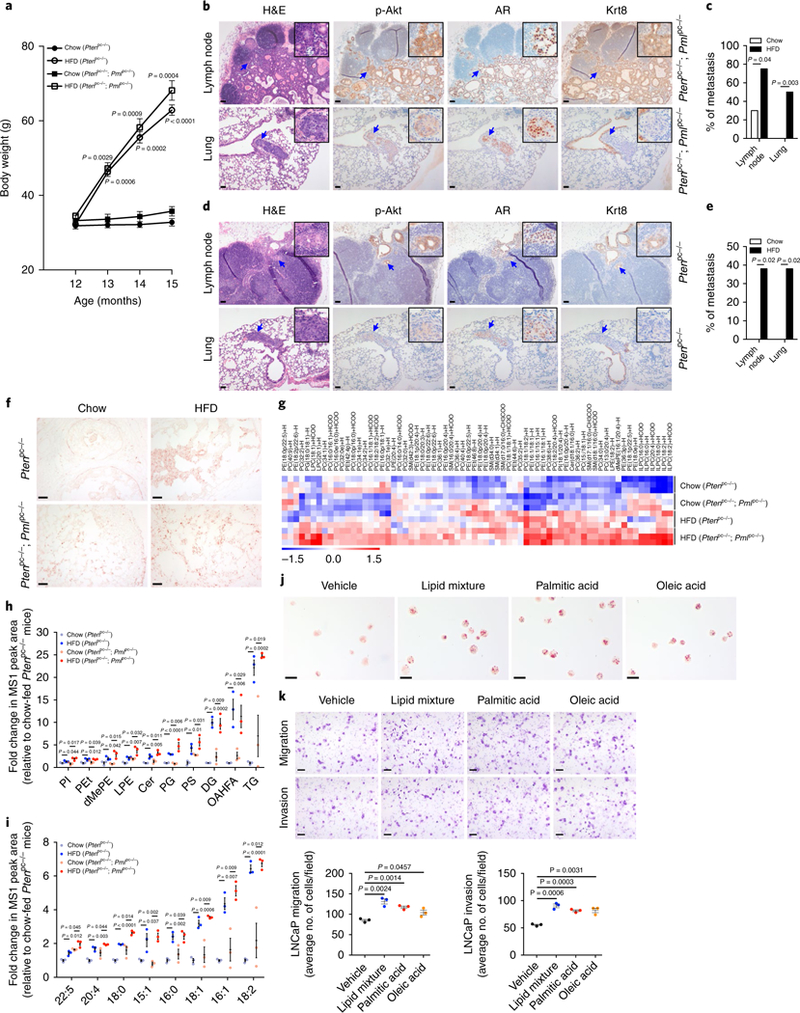
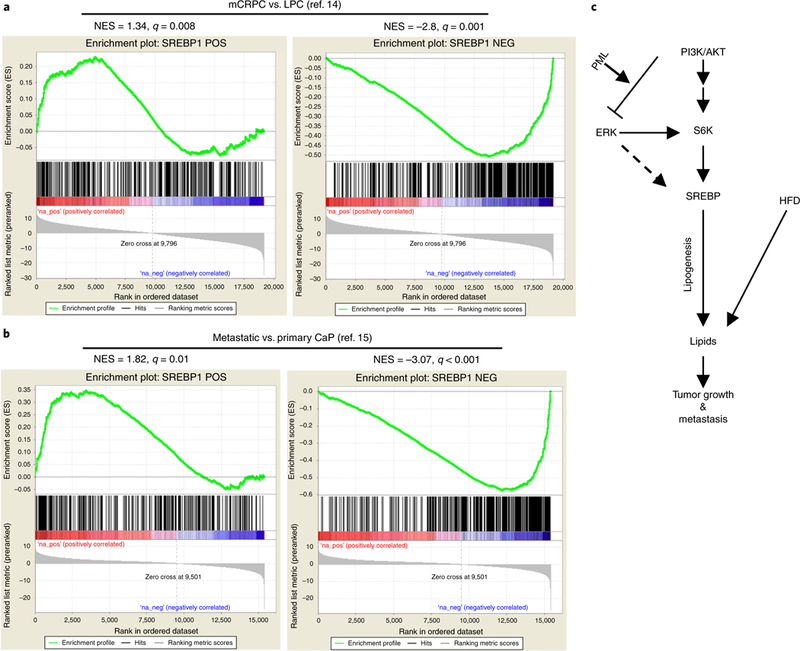
Lipids, either endogenously synthesized or exogenous, have been linked to human cancer. Here we found that PML is frequently co-deleted with PTEN in metastatic human prostate cancer (CaP). We demonstrated that conditional inactivation of Pml in the mouse prostate morphs indolent Pten-null tumors into lethal metastatic disease. We identified MAPK reactivation, subsequent hyperactivation of an aberrant SREBP prometastatic lipogenic program, and a distinctive lipidomic profile as key characteristic features of metastatic Pml and Pten double-null CaP. Furthermore, targeting SREBP in vivo by fatostatin blocked both tumor growth and distant metastasis. Importantly, a high-fat diet (HFD) induced lipid accumulation in prostate tumors and was sufficient to drive metastasis in a nonmetastatic Pten-null mouse model of CaP, and an SREBP signature was highly enriched in metastatic human CaP. Thus, our findings uncover a prometastatic lipogenic program and lend direct genetic and experimental support to the notion that a Western HFD can promote metastasis.


Figures

Fig. 1 |
Fig. 1 |. Co-loss of PTEN and PML expression in advanced and metastatic human CaP.
a–c, Bar graph showing the percentage of deletion of PTEN (a), PML (b) or PTEN and PML (c) in LPC and mCRPC samples from the Grasso et al. dataset. Co-loss events include homozygous, heterozygous or mixed co-loss events. d,e, Bar graph showing the correlation of disease progression with low levels of PTEN (d) or PML (e) protein in primary CaP. The color bar represents the intensity of staining, which was ranked as one of three groups: normal = 2, low = 1 and negative = 0. f, Bar graph showing the percentage of co-loss of PTEN and PML proteins in low-grade and high-grade primary CaP. g, Univariate and multivariable Cox proportional regression analysis of PTEN and PML loss, Gleason score and pathologic stage. h, Kaplan–Meier plot of overall survival data for patients with CaP after radical prostatectomy on the basis of co-loss of PTEN and PML protein. In a–f, n is the number of independent samples. In c and f, Fisher’s exact test (two tailed) was used to determine significance. In d and e, Pearson’s chi-square test was used to determine significance. In h, log-rank test was used to determine significance.
Fig. 2 |
Fig. 2 |. Pml loss renders localized Pten-null tumors lethal and metastatic to lymph nodes.
a, IHC staining for Pml in the DLP and anterior prostate (AP) tissues from WT, Ptenpc−/− and Ptenpc−/−; Pmlpc−/− mice at 12 weeks of age. Scale bar, 20 μm. b, Bar graph showing prostate tumor progression in Ptenpc−/− and Ptenpc−/−; Pmlpc−/− mice in different age cohorts (n = 10). The AP was excluded from the analysis because of cystic lesions after the 12-week time point. HGPIN, high-grade PIN; LGPIN, low-grade PIN. c, Hematoxylin-eosin (H&E)-stained mouse prostate tissues and gross anatomy of representative WT, Ptenpc−/− and Ptenpc−/−; Pmlpc−/− urogenital tracts from mice at 13 months of age (n = 10 mice per genotype). Scale bars, 50 ^m (top) and 5 mm (bottom). d, Plot showing the sphere-forming ability of WT, Ptenpc−/− and Ptenpc−/−; Pmlpc−/− prostate epithelia after serial passage. For comparative purposes, the results are shown as percentages relative to the sphere number of the WT (set at 100%) at the passages examined. Representative images of spheres at P1 are shown at bottom. Scale bars, 20 μm. e, Cumulative survival analysis of WT, Pmlpc−/−, Ptenpc−/− and Ptenpc−/−; Pmlpc−/− mice. f, Incidence of lymph node metastasis (meta) in cohorts of Ptenpc−/− and Ptenpc−/−; Pmlpc−/− mice. g, H&E and IHC staining of lumbar lymph node metastases from two representative Ptenpc−/−; Pmlpc−/− mice. Arrows indicate metastases. Scale bars, 50 μm. p, phospho. In d, the results of one representative experiment are shown (n = 5 experiments). Data are from three independent cultures and are mean±s.e.m. Student’s t test (two tailed) was used to determine significance. In e and f, n is the number of mice. In e, log-rank test was used to determine signifcance. In f, Fisher’s exact test (two tailed) was used to determine significance.
Fig. 3 |
Fig. 3 |. PML loss triggers MAPK reactivation in PTEN-null cells.
a,b, Immunoblot (a) and IHC (b) analyses of the DLP tissues from WT, Pmlpc−/−, Ptenpc−/− and Ptenpc−/−; Pmlpc−/− mice at 12 weeks of age. Scale bars, 50 μm. c-f, Immunoblot of lysates from LNCaP (c) or PC3 (d) cells transfected with control or PML siRNA for 72 h, and of lysates from LNCaP (e) or PC3 (f) cells pretreated with vehicle or 1 arsenic trioxide (AS2O3) for 12 h, serum starved for 4 h and stimulated with 10 ng/ml EGF for 5 min. In a, numbers above blots indicate the relative ratios to values for Ptenpc−/− mice for phosphoprotein/total protein; in c-f, numbers above blots indicate the relative ratios to values for controls for phosphoprotein/total protein; numbers to left of blots indicate molecular weight (kDa). Uncropped images are shown in Supplementary Fig. 7.
Fig. 4 |
Fig. 4 |. An SREBP-dependent lipogenic program is hyperactivated in prostate tumors from Ptenpc−/−; Pmlpc−/− mice.
a, Top enriched biological-process categories from Gene Ontology enrichment analysis among WT, Ptenpc−/− and Ptenpc−/−; Pmlpc−/− prostates. b, GSEA enrichment plot for one of the top-scoring gene sets, SREBP targets, among WT, Ptenpc−/− and Ptenpc−/−; Pmlpc−/− prostates. c,d, Validation of the expression changes in SREBP targets through qPCR (c) and immunoblot (d) analyses of the DLP tissues from WT, Ptenpc−/− and Ptenpc−/−; Pmlpc−/− mice at 12 weeks of age. In d, P and N denote the precursor and cleaved nuclear forms, respectively, of SREBP-1 or SREBP-2. Uncropped images are shown in Supplementary Fig. 7. Numbers to left of blot indicate molecular weight (kDa). e, Scatter plot showing the distribution of all 1,743 identifiable lipid ions in prostate tissues from the three mouse genotypes. Each dot represents one lipid ion, and each color represents a class of lipids. Representative lipid classes (6 out of 35) are shown. Inset, same chart with 3D visual effect with z axis plotting the log10(mean intensity) of each lipid ion across the three genotypes. PS, phosphatidylserine; PG, phosphatidylglycerol; PC, phosphatidylcholine; PE, phosphatidylethanolamine; PI, phosphatidylinositol; PEt, phosphatidylethanol. f,g, A statistically significant increase in abundance of various lipid classes (f) or fatty acyl chains (g) in Ptenpc−/−; Pmlpc−/− tumors compared with Ptenpc−/− tumors. The plot represents fold change in relative intensity. LdMePE, lysodimethylphosphatidylethanolamine; MG, monoglyceride; LPG, lysophosphatidylglycerol. In c, the results of one representative experiment are shown (n = 3 experiments). Data are from three independent mice per genotype and are shown as mean± s.e.m. In f and g, n = 3 mice per genotype; data are shown as mean±s.e.m. Student’s t test (two tailed) was used to determine significance.
Fig. 5 |
Fig. 5 |. SREBP is the downstream target of PML-loss-induced MAPK activation.
a,b, qPCR of SREBP targets in LNCaP (a) or PC3 (b) cells. CaP cells were transfected with control or PML siRNA for 48 h, then treated for 12 h with DMSO or 20 μM U0126 in medium with 10% lipoprotein-deficient serum. c,d, Immunoblot analysis of total lysates or nuclear extracts from LNCaP cells. LNCaP cells were transfected with control or PML siRNA (c) or empty vector or HA-MEK1p.Ser218Asp/p.Ser222Asp (d) for 24h, then treated for 24h with DMSO or 20μM U0126 in medium with 10% lipoprotein-deficient serum. In a and b, the results of one representative experiment are shown (n = 3 experiments). Data are from three independent cultures and are shown as mean±s.e.m. In c and d, the results of one representative experiment are shown (n = 3 experiments). Uncropped images for c and d are shown in Supplementary Fig. 7. Numbers to left of blots indicate molecular weight (kDa).
Fig. 6 |
Fig. 6 |. SREBP-dependent lipogenesis is critical for PML-loss-induced CaP growth and metastasis.
a,b, Representative images and quantification of migrated or invaded LNCaP cells in the migration and invasion assay. LNCaP cells were transfected with the indicated control or target siRNAs against PML or/and SREBP-1 (a) or were pretreated with DMSO, 10 μg/ml TOFA or 10 μM simvastatin (b) for 48 h, then subjected to migration (24 h) or invasion (48 h) assays. Scale bars, 50 μm. c-g, Gross anatomy of representative Ptenpc−/−; Pmlpc−/− tumors (c), quantification of tumor weight (d) and the incidence of metastasis (e) and immunoblot (f) and IHC (g) analyses of tumors from Ptenpc−/−; Pmlpc−/− mice after treatment with vehicle or 15mg/kg fatostatin for two months. Scale bars, 5 mm (c) and 50 μm (g). Arrowheads in g indicate apoptotic cells. In a and b, the results of one representative experiment are shown (n = 5 experiments). Data are from three independent cultures (4 fields per insert). In d, n= 6 mice per treatment. Data shown in a, b and d are mean± s.e.m. Student’s t test (two tailed) was used to determine significance. Uncropped images for f are shown in Supplementary Fig. 7. Numbers to left of blot indicate molecular weight (kDa).
Fig. 7 |
Fig. 7 |. A HFD drives metastatic progression in mouse models of CaP and increases lipid abundance in prostate tumors.
a, HFD-fed mice gain body weight. Mice (n = 8) at 12 months of age were fed chow or HFD for 3 months. Body weights of mice were measured each month. b-e, H&E and IHC staining of metastases in the lumbar lymph node and lung of a representative HFD-fed Ptenpc−/−; Pmlpc−/− mouse (b) or Ptenpc−/− mouse (d) and comparison of the incidence of metastasis between chow-and HFD-fed Ptenpc−/−; Pmlpc−/− mice (c) or Ptenpc−/− mice (e). f, ORO staining of tumors from chow-or HFD-fed Ptenpc−/− and Ptenpc−/−; Pmlpc−/− mice. g-i, Heat map of the top 70 most regulated lipid ions (g), plot of significantly increased lipid classes (h) and plot of fatty acyl chains (i) in tumors from HFD-fed Ptenpc−/− and Ptenpc−/−; Pmlpc−/− mice compared with chow-fed counterparts. dMePE, dimethylphosphatidylethanolamine; LPE, lysophosphatidylethanolamine; Cer, ceramides; DG, diglyceride, OAHFA, (O-acyl)-omega-hydroxy fatty acids; TG, triglyceride. j, ORO staining of vehicle-or dietary-lipid-treated LNCaP cells. k, Representative images and quantification of migrated or invaded LNCaP cells in the migration and invasion assay. LNCaP cells were pretreated with BSA vehicle control, 2% lipid mixture, or 30 μm BSA-conjugated palmitic acid or oleic acid for 7 d, then subjected to migration (24h) or invasion (48 h) assays. Arrows in b and d indicate metastases. In c, chow-fed mice (n = 20) and HFD-fed mice (n = 8). In e, chow-fed mice (n = 19) and HFD-fed mice (n = 8). In h and i, n = 3 mice per group. In k, the results of one representative experiment are shown (n = 5 experiments). Data are from three independent cultures (4 fields per insert). In a, h, i and k, data shown are mean ±s.e.m. Student’s t test (two tailed) was used to determine significance. In c and e, Fisher’s exact test (two tailed) was used to determine significance. Scale bars in all panels, 50 μm.
Fig. 8 |
Fig. 8 |. An SREBP signature is highly enriched in metastatic human CaP.
a,b, GSEA enrichment plot for the gene set derived from the SREBP-1 signature. The up-to downregulated genes from the ranked gene list for metastasis vs. primary samples in the Grasso et al. (a) or Taylor et al. (b) dataset were analyzed with the GSEA algorithm for enrichment of the SREBP-1 signature. The SREBP-1 signature was inferred through an information-theory-based CLR algorithm by using the RNA-seq data from The Cancer Genome Atlas normal prostate samples. The SREBP-1 signature was split into two subsets: positively correlated (POS) and negatively correlated (NEG) between SREBP-1 and its targets. (c) Mechanisms of aberrant lipid metabolism, regulated by PML, and the increased lipid influx by HFD as a potential risk factor for metastatic CaP.

Comment in

References

    1. Wu JN, Fish KM, Evans CP, Devere White RW & Dall’Era MA No improvement noted in overall or cause-specific survival for men presenting with metastatic prostate cancer over a 20-year period. Cancer 120, 818–823 (2014). - PubMed
    1. Yang M et al. Dietary patterns after prostate cancer diagnosis in relation to disease-specific and total mortality. Cancer Prev. Res. (Phila.) 8, 545–551 (2015). - PMC - PubMed
    1. Grönberg H Prostate cancer epidemiology. Lancet 361, 859–864 (2003). - PubMed
    1. Markozannes G et al. Diet, body size, physical activity and risk of prostate cancer: an umbrella review of the evidence. Eur. J. Cancer 69, 61–69 (2016). - PubMed
    1. Zhu Y et al. Dietary patterns and colorectal cancer recurrence and survival: a cohort study. BMJ Open 3, e002270 (2013). - PMC - PubMed

Publication types

MeSH terms

Substances