. 2018 Feb;50(2):238-249.
doi: 10.1038/s41588-017-0030-7. Epub 2018 Jan 15.

Transcription factors orchestrate dynamic interplay between genome topology and gene regulation during cell reprogramming

Affiliations

Transcription factors orchestrate dynamic interplay between genome topology and gene regulation during cell reprogramming

Ralph Stadhouders et al. Nat Genet. 2018 Feb.

Abstract

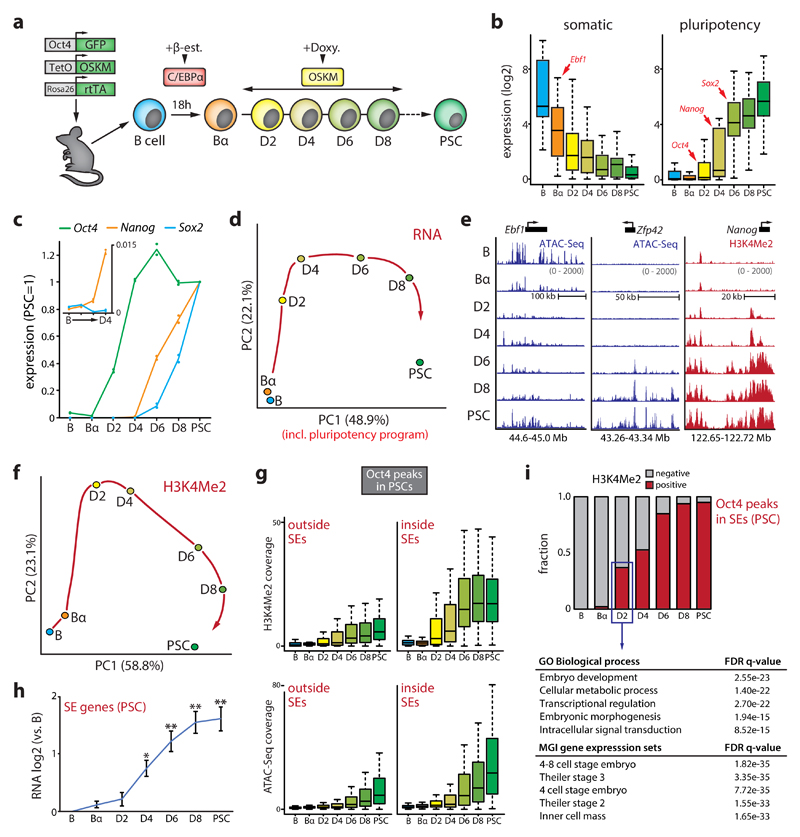
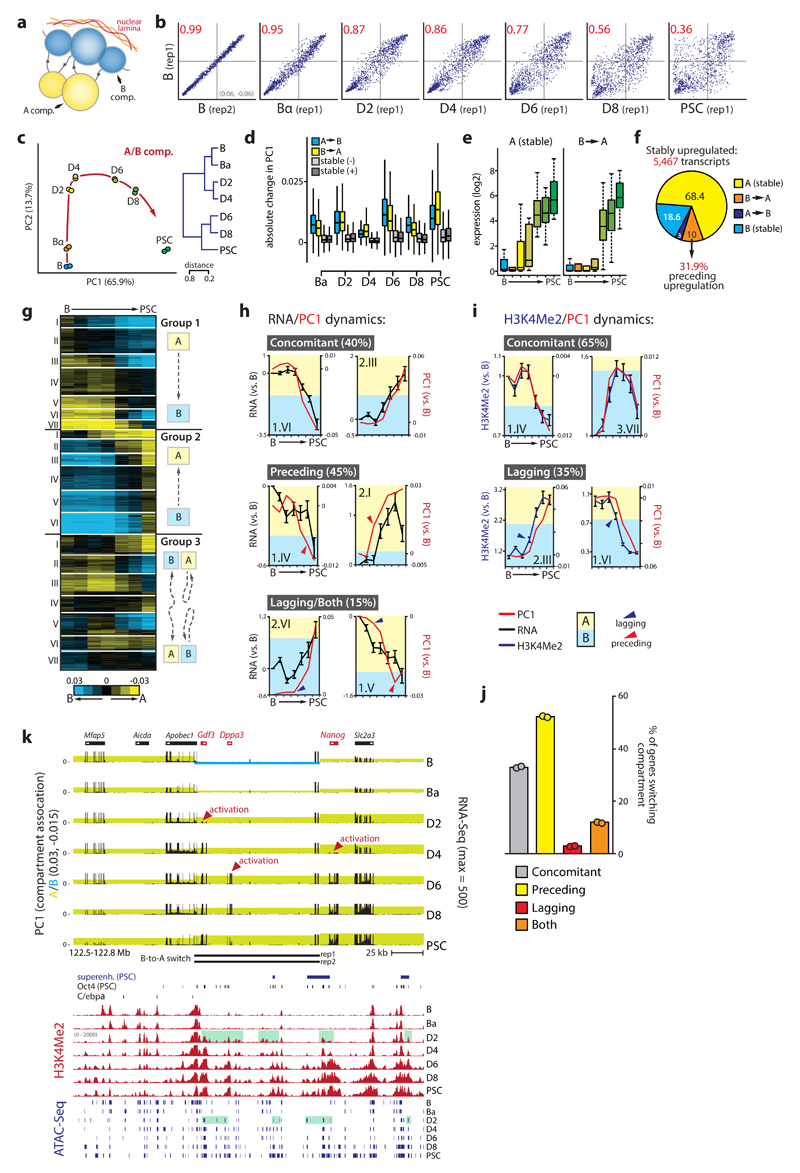
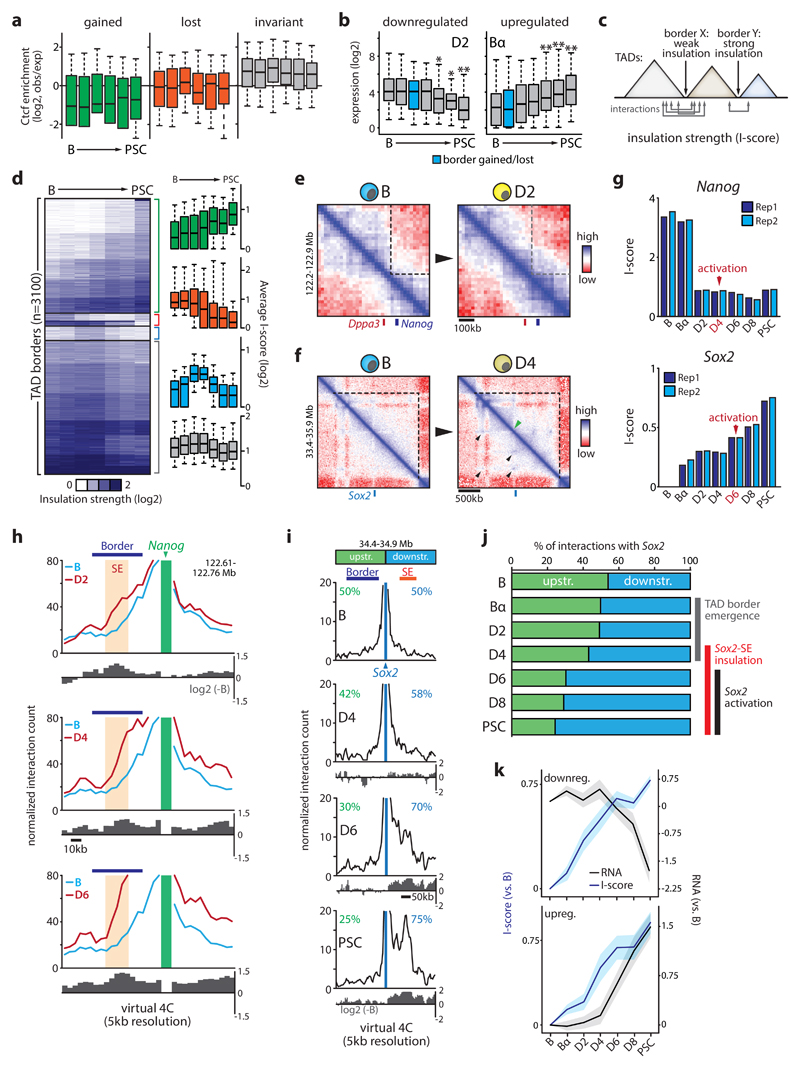
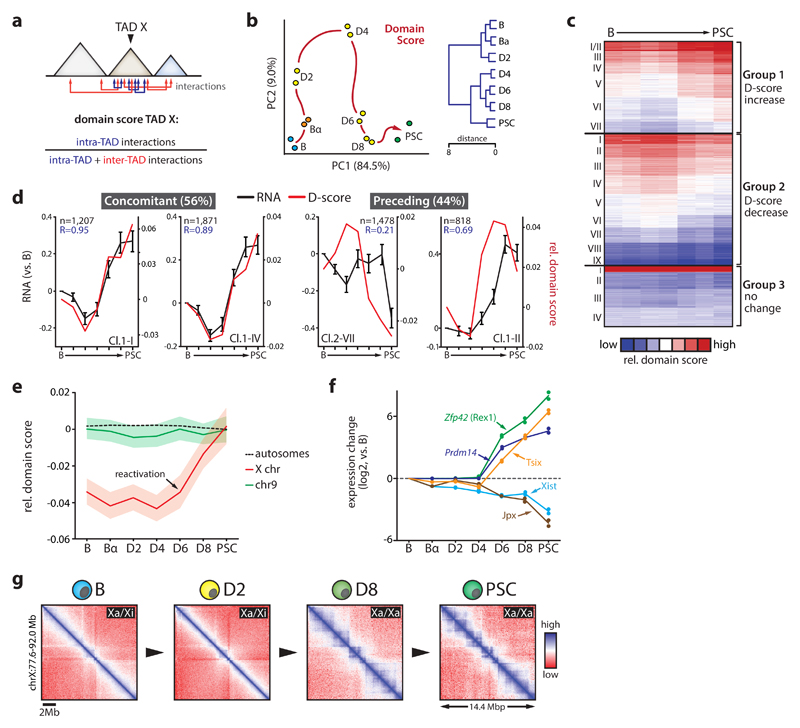
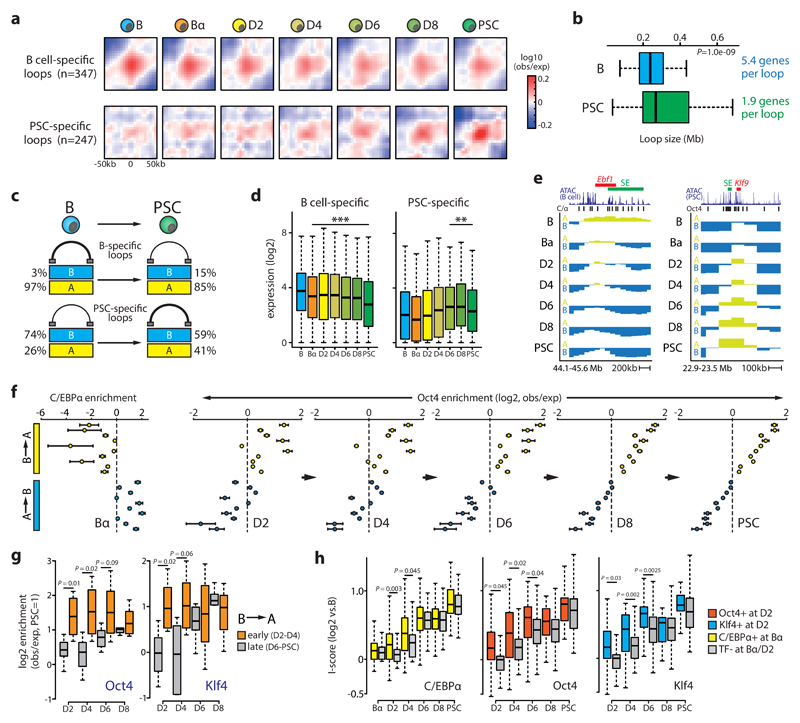
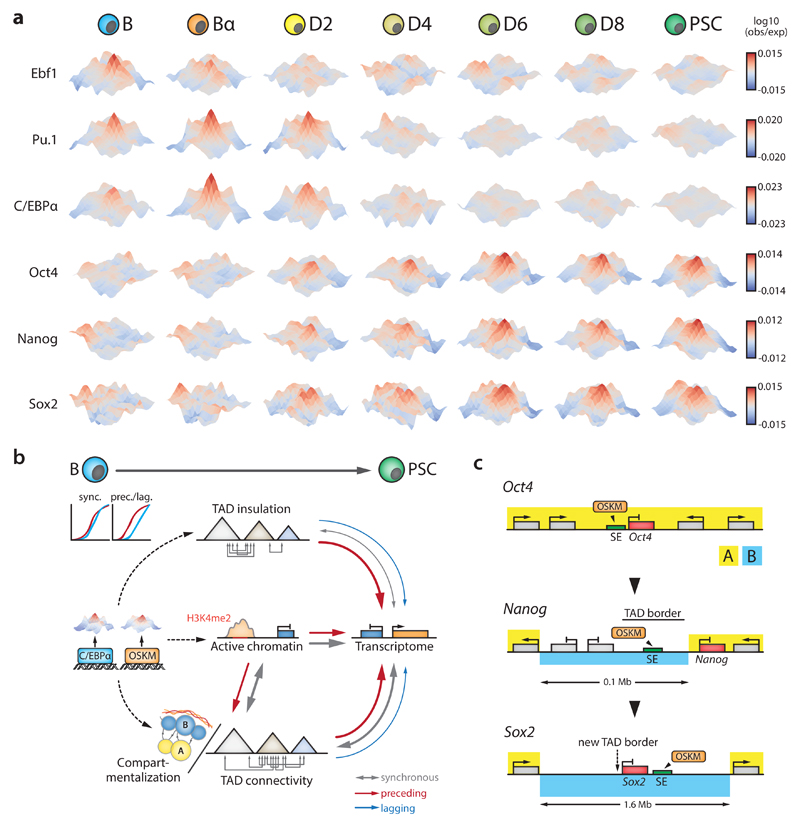
Chromosomal architecture is known to influence gene expression, yet its role in controlling cell fate remains poorly understood. Reprogramming of somatic cells into pluripotent stem cells (PSCs) by the transcription factors (TFs) OCT4, SOX2, KLF4 and MYC offers an opportunity to address this question but is severely limited by the low proportion of responding cells. We have recently developed a highly efficient reprogramming protocol that synchronously converts somatic into pluripotent stem cells. Here, we used this system to integrate time-resolved changes in genome topology with gene expression, TF binding and chromatin-state dynamics. The results showed that TFs drive topological genome reorganization at multiple architectural levels, often before changes in gene expression. Removal of locus-specific topological barriers can explain why pluripotency genes are activated sequentially, instead of simultaneously, during reprogramming. Together, our results implicate genome topology as an instructive force for implementing transcriptional programs and cell fate in mammals.


Conflict of interest statement

Competing Financial Interests

The authors declare no competing financial interests.

Figures

Figure 1
Figure 1. Dynamics of the transcriptome and epigenome during reprogramming.
(a) Schematic overview of the reprogramming system. C/EBPα-ER in B cells is translocated into the nucleus upon beta-estradiol (β-est.) treatment. After β-est. wash-out, Oct4, Sox2, Klf4 and Myc (OSKM) are induced by doxycycline (doxy.). (b) Box plots of gene expression dynamics (normalized counts) of a set of core B cell (‘somatic’, n=25) and PSC (‘pluripotency’, n=25) identity genes. (c) Average gene expression kinetics of Oct4, Nanog and Sox2 during reprogramming (n=2, relative to the levels in PSCs). Inset shows Nanog expression first appears at D4. (d) Principal component analysis (PCA) of gene expression dynamics (n=16,332 genes) during reprogramming. A red arrow indicates hypothetical trajectory. (e) Representative examples of chromatin opening (measured by ATAC-Seq) and H3K4Me2 deposition (measured by ChIPmentation) at gene regulatory elements controlling B cell (Ebf1) or pluripotency (Zfp42 and Nanog) genes. (f) PCA of H3K4Me2 dynamics during reprogramming (n=26,351 100kb genomic bins). A red arrow indicates hypothetical trajectory. (g) Box plots of dynamics of H3K4Me2 deposition (top) and chromatin accessibility (bottom) at Oct4 binding sites outside (n=31,869) and inside (n=821) PSC superenhancers (SEs). (h) Expression dynamics of genes associated with a SE in PSCs (mean values shown, n=328 genes). Error bars denote 95% CI. (*P<0.01, **P<0.001 versus B cells, unpaired two-tailed t-test). (i) Fraction of H3K4Me2+ Oct4 binding sites in PSC SEs (n=821) during reprogramming; table shows a gene ontology (GO) analysis for SE genes (n=212) associated with early Oct4 recruitment.
Figure 2
Figure 2. Kinetics of subnuclear compartmentalization, the transcriptome and epigenome.
(a) Schematic representation of chromosome compartments. (b) Scatterplots of PC1 values (n=26,370 100kb bins) showing changes to initial B cell genome compartmentalization for chromosome 13. Pearson correlation coefficient (R2) is indicated in red. (c) Principal component analysis (red arrow indicates hypothetical trajectory) and unsupervised hierarchical clustering (right) of PC1 values (n=26,370 bins). (d) Absolute PC1 changes per timepoint for regions (n=35,348) that switch compartment or do not switch (‘stable’) but increase (-) or decrease (+) in PC1 value. (e) Box plots of normalized transcript counts for key pluripotency genes (n=25) that are stably associated with the A compartment or switch from B to A. (f) Compartment switching at stably upregulated genes. (g) k-means clustering (k=20) of PC1 values for 100kb genomic bins that switch compartment at any timepoint. (h) Examples of individual switching clusters with concomitant mean gene expression and PC1 changes (8/20), clusters with PC1 changes preceding expression changes (9/20), and clusters with expression changes preceding PC1 changes (1/20) or with both phenomena (2/20). (i) Examples of individual switching clusters that show concomitant mean PC1/H3K4Me2 changes (13/20) or H3K4Me2 kinetics preceding PC1 modulation (7/20). (j) Proportion of genes (n=8,218) located in the different categories of switching clusters. (k) Genome browser view of the Gdf3-Dppa3-Nanog locus. Top part shows integrated PC1 (shading denotes A/B compartment status) and RNA-Seq values, with B-to-A switch regions per replicate indicated below. Bottom part depicts superenhancer (SE) location, Oct4 binding, C/EBPα binding, H3K4Me2 dynamics and ATAC-Seq peaks. Green shading indicates priming of Dppa3/Nanog enhancers at D2. Error bars in the figure represent SEM.
Figure 3
Figure 3. Kinetics of domain insulation during reprogramming.
(a) Ctcf enrichment dynamics (from ChIP-Seq experiments during reprogramming) at TAD borders that are gained (n=431), lost (n=124) or invariant (n=2,185) during reprogramming. (b) Gene expression dynamics at transcriptionally modulated border regions (divided into up or downregulated groups per timepoint) gained or lost D2 or Bα stages (*P<0.05, **P<0.005 versus B cells; unpaired two-tailed t-test). Sample sizes are indicated in Supplementary Fig.5. (c) Cartoon illustrating the concept of the insulation strength score (I-score). (d) k-means clustering (k=20) of I-score. Bar graphs show I-score kinetics for groups that increase (n=1,291), decrease (n=141), transiently increase (n=159) or do not change (n=1,509). (e) Representative in-situ Hi-C contact maps (20kb resolution) of the Dppa3-Nanog border or (f) the internal Sox2 border comparing. Black arrows indicate loops; green arrow indicates border formation. (g) I-score kinetics of the Nanog and Sox2 borders. (h,i) Representative virtual 4C analysis using Nanog (panel h) or Sox2 (panel i) as viewpoints. TAD border and superenhancer (SE) are indicated. Log2 ratio (over B) is shown below each line graph, percentages shown in panel i depict proportions of all interactions with Sox2. (j) Proportion of interactions with Sox2 from the immediate upstream or downstream region (indicated in panel i). Timing of key events involved in Sox2 activation is indicated. (k) Gene expression and I-score kinetics at dynamic border regions where I-score changes precede transcriptional modulation (49%, n=43/88). Line graphs depict I-score and gene expression dynamics for those borders where gene expression is downregulated or upregulated. Error bars/shading represent 95% CI.
Figure 4
Figure 4. Dynamics of TAD connectivity during reprogramming.
(a) Cartoon depicting domain score (D-score) calculation. Arrows indicate intra or inter TAD interactions. (b) Principal component analysis (left) and unsupervised hierarchical clustering (right) of D-score kinetics (n=2,153 TADs). Red arrow indicates hypothetical trajectory. (c) k-means clustering (k=20) of genome-wide relative D-score (centered on mean). (d) Examples of individual dynamic D-score clusters for which gene expression and D-Score kinetics (mean values presented, number of genes per cluster indicated) are concomitant or where D-score changes precede transcriptional changes. Error bars show SEM. R-values denote Pearson correlation coefficients. (e) Average relative D-score changes for chromosome 9 (n=115 TADs), all autosomes combined (n=1,959 TADs) and the X chromosome (n=106 TADs). Shading denotes 95% CI. (f) Mean gene expression changes (versus B cells, n=2 independent biological replicate reprogramming expriments) of key regulators of X-chromosome re/inactivation during reprogramming. (g) Representative in-situ Hi-C contact maps (50kb resolution) of a 14.5 Mb region on the X chromosome during reprogramming. B-D2 cells carry one inactive X (Xi) and one active X (Xa) chromosome; D8-PSC cells carry two Xa.
Figure 5
Figure 5. Chromatin loop and transcription factor binding dynamics.
(a) Meta-loop analysis at 5kb resolution of B cell or PSC-specific loops. Area shown is centered on the respective TF binding sites (+/- 50kb). (b) Boxplot showing median loop size (P=1.0e-09, Wilcoxon rank sum test) and average number of genes per loop for B cell (n=347) or PSC-specific (n=247) loops. (c) Cartoon depicting percentage of B cell or PSC-specific loops within A or B compartments in reprogramming end stages. (d) Boxplot showing gene expression dynamics of genes within B cell (left, n=1874)) or PSC-specific (right, n=469) loops (**P<0.005, ***P<0.001 versus B cells; Wilcoxon rank sum test). (e) Examples of C/EBPα-mediated A-to-B switching (Ebf1 locus) and OSKM-mediated B-to-A switching (Klf9 locus). Superenhancer (SE) location is indicated. (f) C/EBPα and Oct4 binding enrichment (inferred from ChIP-Seq and ATAC-Seq, respectively, see Supplemental Materials) relative to the genome-wide average at the 20 switching clusters shown in Fig.2g. Mean values with 95% CI are shown. (g) Box plots showing Oct4 and Klf4 binding enrichment in clusters (n=10) that switch B-to-A compartment early (D2-D4) or late (D6-PSC). Statistically significance was assessed using an unpaired two-tailed t-test. (h) Insulation strength (I-score) dynamics at hyper-dynamic borders (n=184) bound (n=123 for C/EBPα; n=37 for Oct4; n=22 for Klf4) or not bound (n=61 for C/EBPα; n=147 for Oct4; n=162 for Klf4) by the indicated TFs. Statistically significance was assessed using an unpaired two-tailed t-test).
Figure 6
Figure 6. Dynamics of 3D crosstalk between transcription factor target sites and model schemes.
(a) 3D interaction meta-plots (5kb resolution) depicting interaction frequencies of sites bound by the indicated TFs during reprogramming. Hubs visualize inter-TAD crosstalk between TF binding sites 2-10 Mb apart. Area shown is centered on the respective TF binding sites (+/- 50kb). (b) Summary scheme depicting the interplay between TF binding, chromatin state, various aspects of genome topology and gene regulation during cell reprogramming. Arrows denote synchronous, preceding or lagging relationships. Arrow thickness indicates prevalence. (c) Activation scenarios for the pluripotency factors Oct4, Nanog and Sox2. Oct4 activation does not seem to require major topological modifications, as the gene and its superenhancer (SE) already reside in the A compartment in B cells and TAD border strength is unaltered. In contrast, Nanog activation is preceded by B-to-A compartment switching of its nearby SE as well as a decrease in TAD border strength that facilitates Nanog-SE interaction. Sox2 activation is preceded by the formation of a new TAD border through chromatin loop formation that progressively insulates the gene and its SE into a smaller subdomain. The complete 1.6 Mb Sox2 region switches from the B to the A compartment, concomitant with activation of the gene at D6.

Comment in

References

    1. Buganim Y, Faddah DA, Jaenisch R. Mechanisms and models of somatic cell reprogramming. Nat Rev Genet. 2013;14:427–39. - PMC - PubMed
    1. Apostolou E, Hochedlinger K. Chromatin dynamics during cellular reprogramming. Nature. 2013;502:462–71. - PMC - PubMed
    1. de Laat W, Duboule D. Topology of mammalian developmental enhancers and their regulatory landscapes. Nature. 2013;502:499–506. - PubMed
    1. Gorkin DU, Leung D, Ren B. The 3D genome in transcriptional regulation and pluripotency. Cell Stem Cell. 2014;14:762–75. - PMC - PubMed
    1. Dekker J, Mirny L. The 3D Genome as Moderator of Chromosomal Communication. Cell. 2016;164:1110–21. - PMC - PubMed

Publication types

MeSH terms

Substances