. 2018 Jan 15;8(1):734.
doi: 10.1038/s41598-018-19160-0.

Alteration in Fluidity of Cell Plasma Membrane in Huntington Disease Revealed by Spectral Phasor Analysis

Affiliations

Alteration in Fluidity of Cell Plasma Membrane in Huntington Disease Revealed by Spectral Phasor Analysis

Sara Sameni et al. Sci Rep. .

Erratum in

Abstract

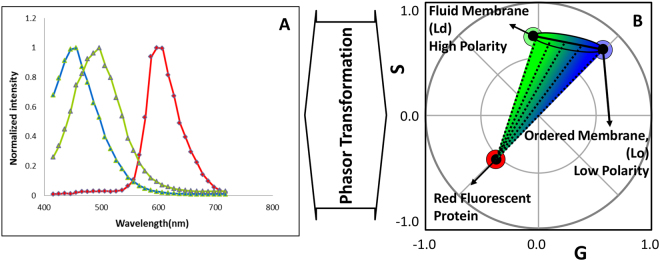
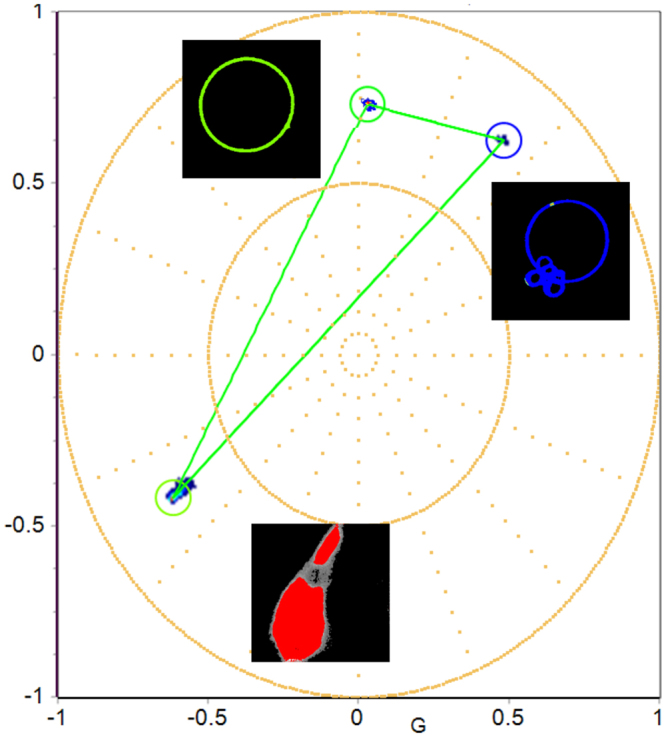
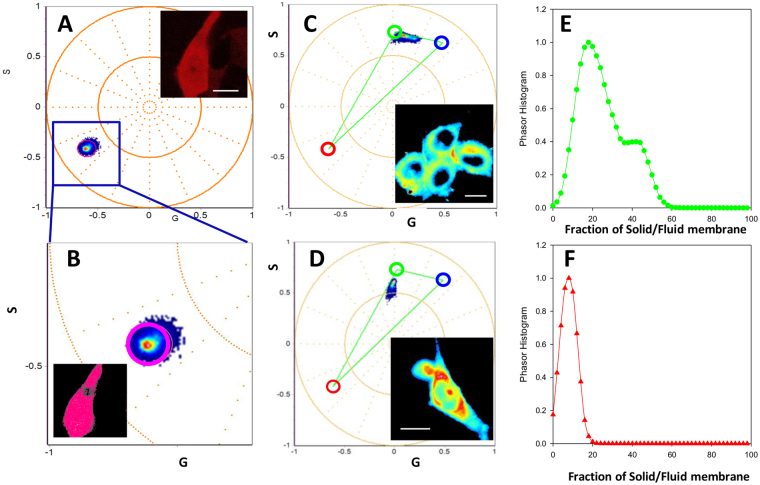
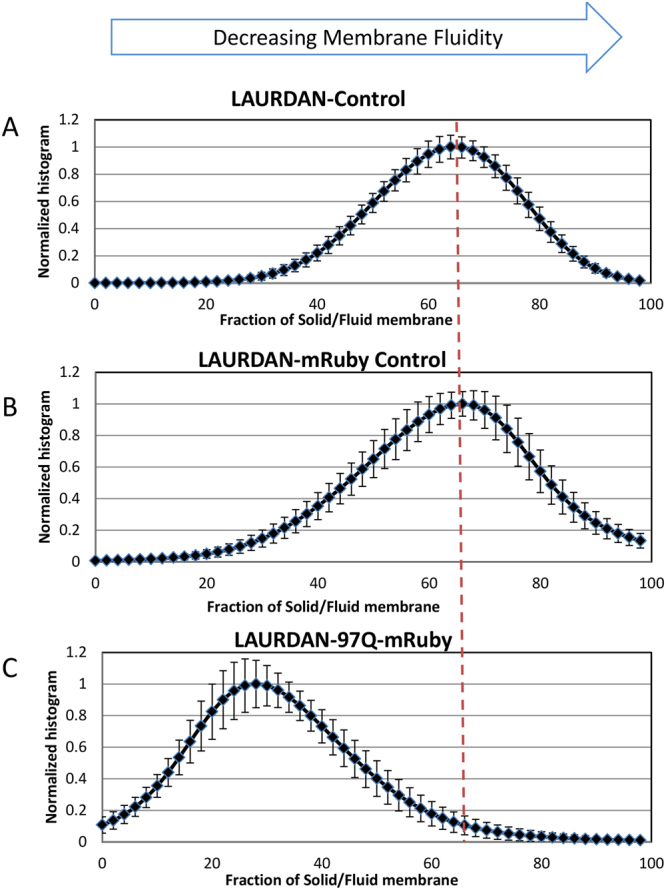
Huntington disease (HD) is a late-onset genetic neurodegenerative disorder caused by expansion of cytosine-adenine-guanine (CAG) trinucleotide in the exon 1 of the gene encoding the polyglutamine (polyQ). It has been shown that protein degradation and lipid metabolism is altered in HD. In many neurodegenerative disorders, impaired lipid homeostasis is one of the early events in the disease onset. Yet, little is known about how mutant huntingtin may affect phospholipids membrane fluidity. Here, we investigated how membrane fluidity in the living cells (differentiated PC12 and HEK293 cell lines) are affected using a hyperspectral imaging of widely used probes, LAURDAN. Using phasor approach, we characterized the fluorescence of LAURDAN that is sensitive to the polarity of the immediate environment. LAURDAN is affected by the physical order of phospholipids (lipid order) and reports the membrane fluidity. We also validated our results using a different fluorescent membrane probe, Nile Red (NR). The plasma membrane in the cells expressing expanded polyQ shows a shift toward increased membrane fluidity revealed by both LAURDAN and NR spectral phasors. This finding brings a new perspective in the understanding of the early stages of HD that can be used as a target for drug screening.


Conflict of interest statement

The authors declare that they have no competing interests.

Figures

Figure 1
Figure 1
Spectral phasor transformation and the three-component analysis. (A) Three spectra for LAURDAN (in a low or high polarity environment, blue and green spectra respectively) and for a red fluorescence protein (RFP). (B) The Phasor polar plot with the transformed spectral emissions and a single spot for the emission of LAURDAN in ordered membrane (Lo), fluid membrane (Ld) and a red fluorescent protein (RFP) (blue, green and red dots, respectively). The spectral longer wavelength shift is represented by a counterclockwise shift in the phasor plot from the coordinate (1, 0). The spectra of the LAURDAN are shown in an ellipsoid in 1B which is colored in a gradient from green (high polarity environment) to blue (low polarity environment). If LAURDAN is coexisting with a RFP in the same pixel, then the pixels should fall in a dotted line shown in the picture connecting RFP to LAURDAN trajectory.
Figure 2
Figure 2
Three component analysis depicting LAURDAN fluorescence emission in Ld/Lo in GUVs and mRuby expressing cells (differentiated 97QmRuby). The framework for the three-component analysis is done by defining the emission of LAURDAN in the liquid disorder (Ld, DOPC, green GUV) or liquid ordered (Lo, DPPC: Cholesterol, 1:1 molar, blue GUV) membranes, and cells expressing the 97Q-mRuby (cell colored by red cursor).
Figure 3
Figure 3
Phasor plot signature for PC12 cell stained with or without LAURDAN. (A) Zoomed region from the phasor plot in (B) showing a pink cursor highlighting the spectral emission of mRuby of a differentiated PC12 cells expressing 97Q-mRuby in the absence of LAURDAN. Using a pink cursor at the phasor plot we can color code the pixels at the spectral image (see pseudo color image on the top figure). (C) Differentiated PC 12 cells stained with LAURDAN in the absence of mRuby with its corresponding fluidity fraction histogram shown in E. The histograms (E&F) indicate the position along the green/trajectory that identifies the fluidity fraction. Here, green cursors means high and blue means low fluidity. (D) Differentiated PC12 cells expressing 97Q-mRuby stained with LAURDAN. A trajectory representing all the linear combinations between LAURDAN and the 97Q-mRuby can be seen on the phasor plot. The spectra intensity image is provided on the right side of the spectral graph with the corresponding fluidity histogram shown on (F). All Scale bars have a length of 10 μm.
Figure 4
Figure 4
Mapping the emission spectra of LAURDAN and mRuby using spectral Phasor plot in differentiated PC12 cells. (A) Differentiated PC12 cells stained with LAURDAN alone are highlighted by the light green and dark blue cursors corresponding to the Ld and Lo phases, respectively. The Ld and Lo spectral emission coordinates were plotted from DOPC and DPPC GUVs (light green and purple cursors; respectively). (B) Shows the red pseudo-color image of mRuby alone. (C) Corresponding Spectral phasor plot are depicted here in which the light green (Ld) phase and the purple (Lo) phase are connected to the red cursor (mRuby) to make the theoretical triangle of the three pure emission peaks, in gray. As it is shown in D, 97Q-mRuby is characterized with increased fluidity in membrane (shift to Ld phase, highlighted in dark green) compared to the controls (LAURDAN alone and mRuby + LAURDAN, blue color, Lo phase). Scale bar in images are 10 μm.
Figure 5
Figure 5
Normalized histograms of the solid to fluid fractions in PC12 cell membranes. (A) Cells were stained with LAURDAN only. (B) PC12 cells expressing mRuby stained with LAURDAN. (C) Histogram of the solid to fluid fraction in cells expressing 97Q-mRuby stained with LAURDAN showing a shift toward increased membrane fluidity (Ld phase) compared to control lines(top two curves, A&B). Data are averaged for N = 25 for LAURDAN-Control, N = 19 for LAURDAN-mRuby-CTR, and N = 16 for 97QmRuby, N = number of the cells, standard deviation are represented with error bars.
Figure 6
Figure 6
Fluidity index. Cells expressing 97Q-mRuby have a decrease in membrane fluidity index indicating increased membrane fluidity compared to controls.

References

    1. Chiti F, Dobson CM. Protein Misfolding, Functional Amyloid, and Human Disease. Annual Review of Biochemistry. 2006;75:333–366. doi: 10.1146/annurev.biochem.75.101304.123901. - DOI - PubMed
    1. Arrasate M, et al. Inclusion body formation reduces levels of mutant huntingtin and the risk of neuronal death. Nature. 2004;431:805–810. doi: 10.1038/nature02998. - DOI - PubMed
    1. Davies SW, et al. Formation of Neuronal Intranuclear Inclusions Underlies the Neurological Dysfunction in Mice Transgenic for the HD Mutation. Cell. 1997;90:537–548. doi: 10.1016/S0092-8674(00)80513-9. - DOI - PubMed
    1. Sameni, S., Adeela Syed, J. L Marsh & Digman, M. A. The phasor-FLIM fingerprints reveal shifts from OXPHOS to enhanced glycolysis in Huntington Disease. Nature scientific reports (2016). - PMC - PubMed
    1. Block RC, Dorsey ER, Beck CA, Brenna JT, Shoulson I. Altered Cholesterol and Fatty Acid Metabolism in Huntington Disease. Journal of clinical lipidology. 2010;4:17–23. doi: 10.1016/j.jacl.2009.11.003. - DOI - PMC - PubMed

Publication types