. 2018 Feb;21(2):195-206.
doi: 10.1038/s41593-017-0057-1. Epub 2018 Jan 15.

N6-methyladenosine RNA modification regulates embryonic neural stem cell self-renewal through histone modifications

Affiliations

N6-methyladenosine RNA modification regulates embryonic neural stem cell self-renewal through histone modifications

Yang Wang et al. Nat Neurosci. 2018 Feb.

Erratum in

Abstract

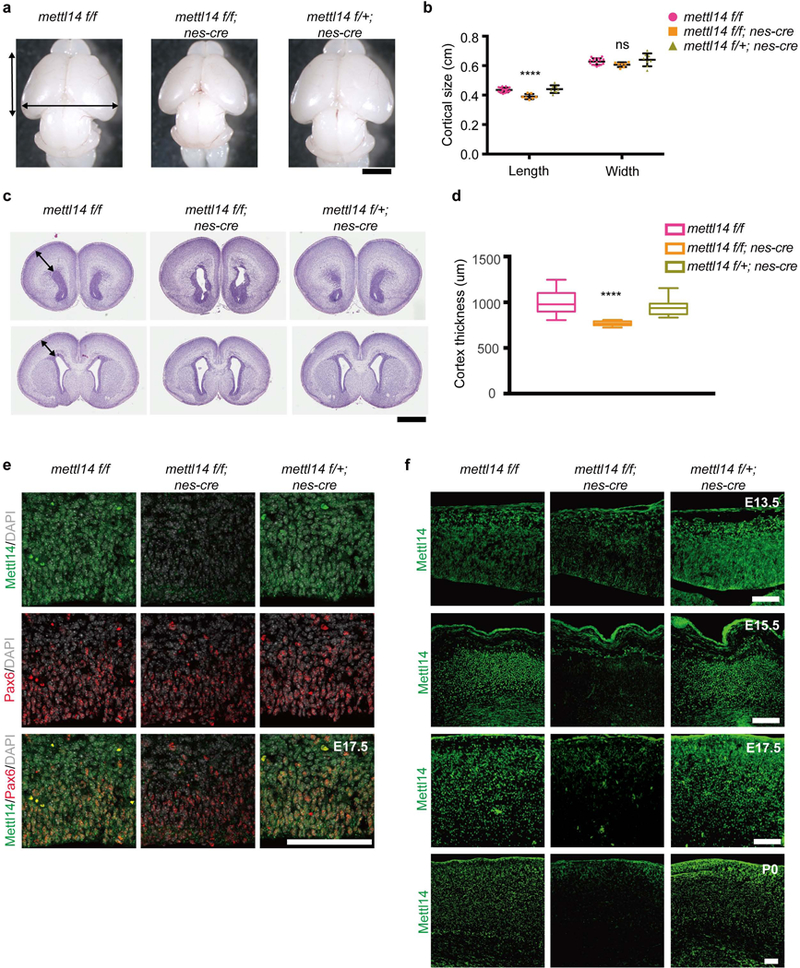
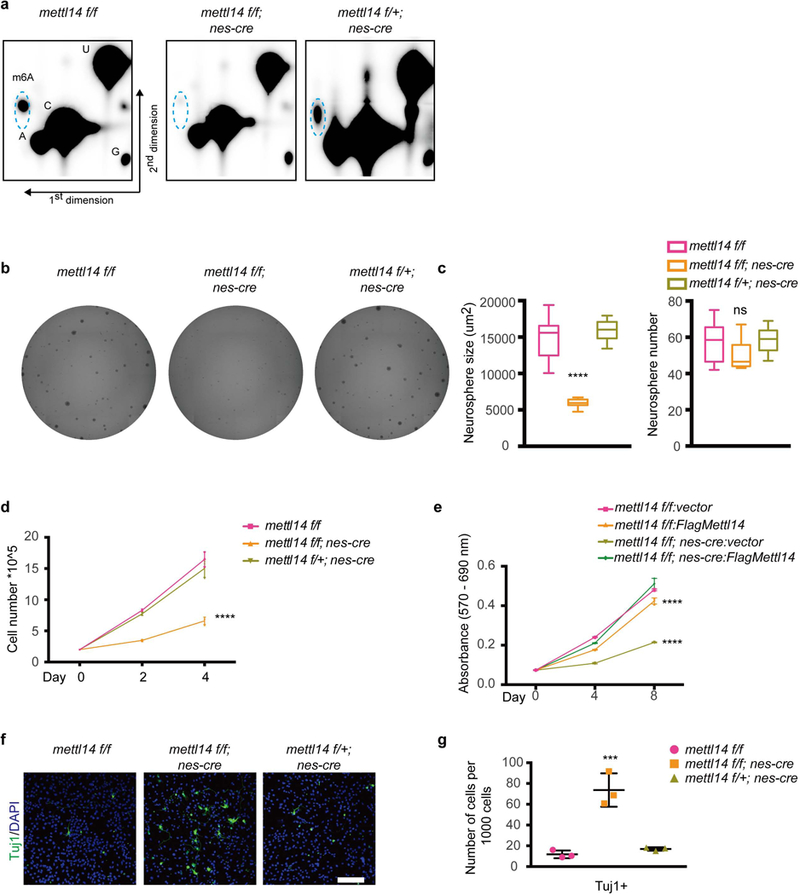
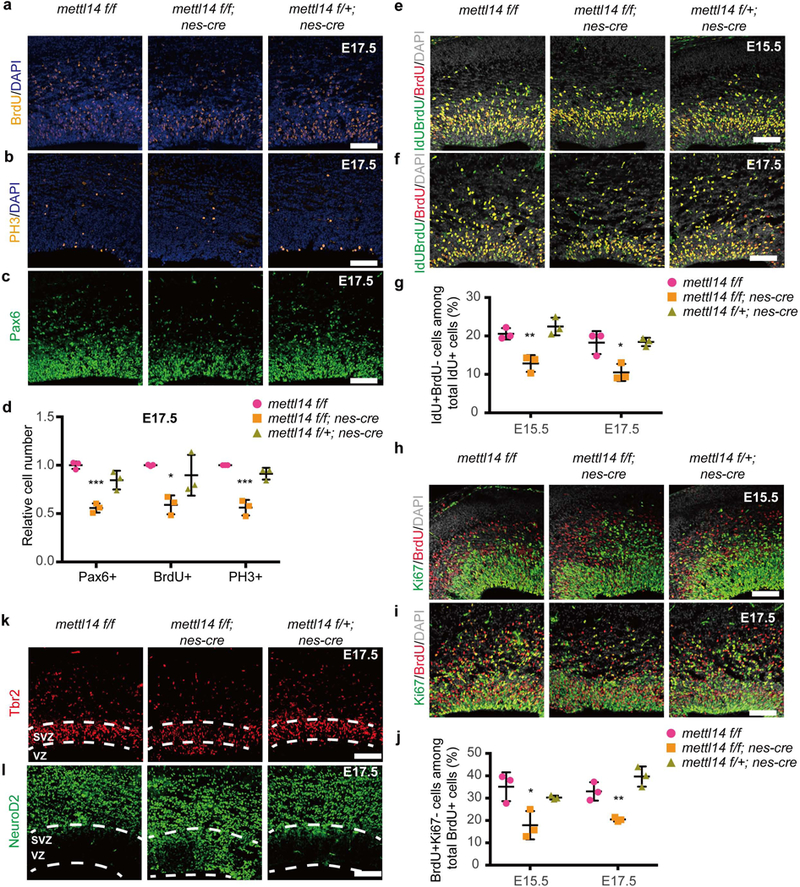
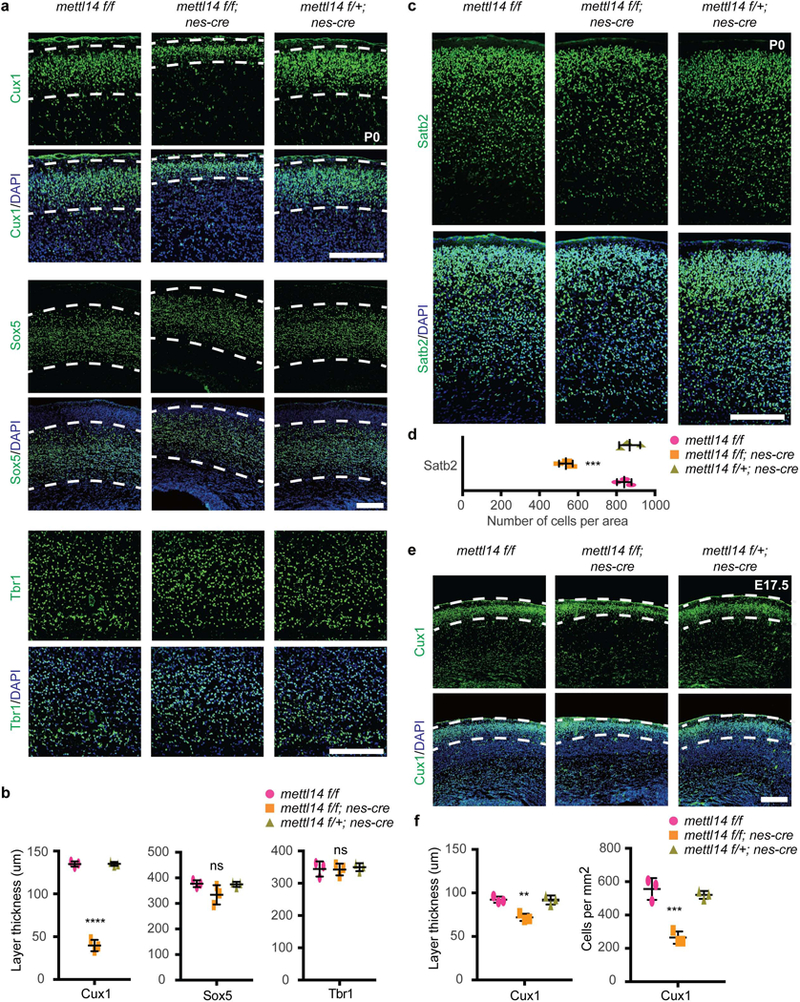
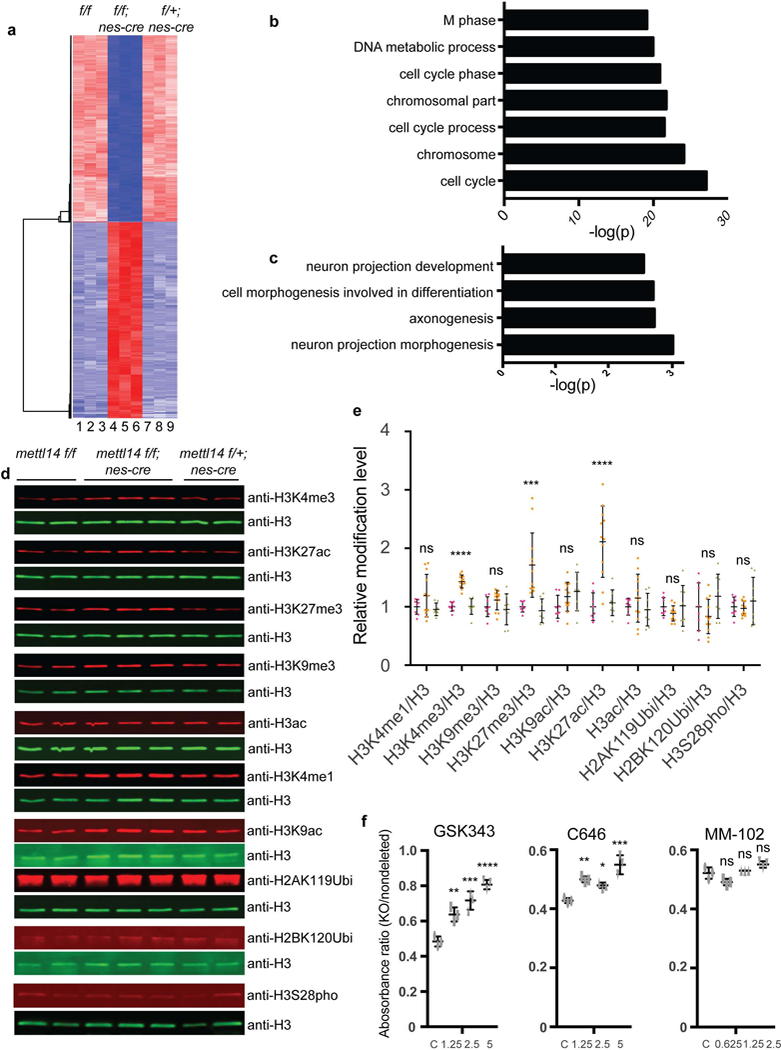
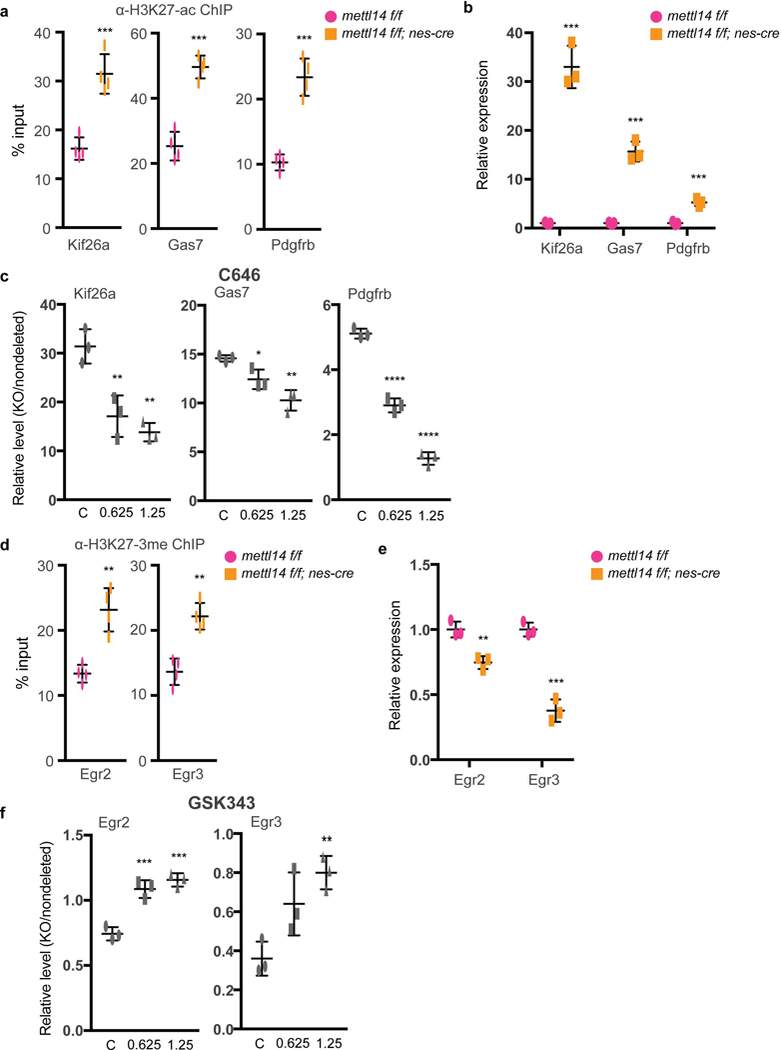
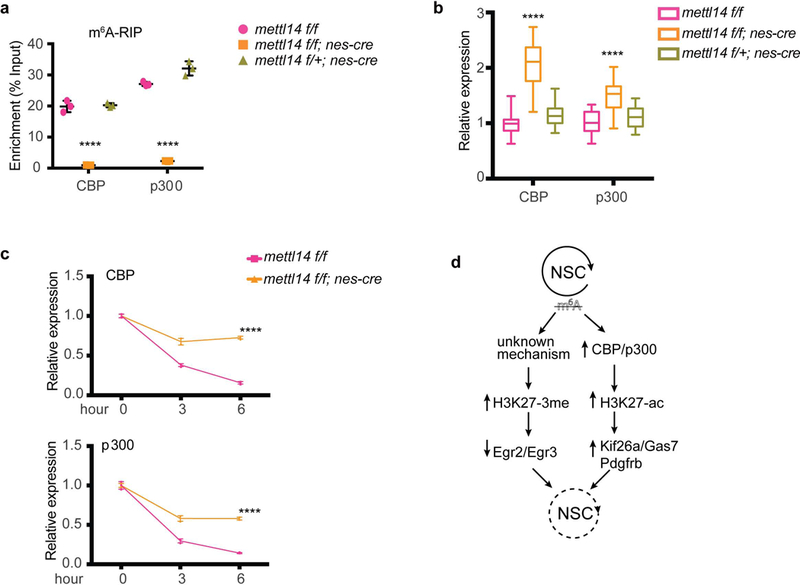
Internal N6-methyladenosine (m6A) modification is widespread in messenger RNAs (mRNAs) and is catalyzed by heterodimers of methyltransferase-like protein 3 (Mettl3) and Mettl14. To understand the role of m6A in development, we deleted Mettl14 in embryonic neural stem cells (NSCs) in a mouse model. Phenotypically, NSCs lacking Mettl14 displayed markedly decreased proliferation and premature differentiation, suggesting that m6A modification enhances NSC self-renewal. Decreases in the NSC pool led to a decreased number of late-born neurons during cortical neurogenesis. Mechanistically, we discovered a genome-wide increase in specific histone modifications in Mettl14 knockout versus control NSCs. These changes correlated with altered gene expression and observed cellular phenotypes, suggesting functional significance of altered histone modifications in knockout cells. Finally, we found that m6A regulates histone modification in part by destabilizing transcripts that encode histone-modifying enzymes. Our results suggest an essential role for m6A in development and reveal m6A-regulated histone modifications as a previously unknown mechanism of gene regulation in mammalian cells.


Figures

Figure 1:
Figure 1:. Mettl14 regulates the size of mouse cerebral cortex.
(a) Representative images of whole brains from Mettl14f/f (WT, left), Mettl14f/f;nes-cre (KO, middle) or Mettl14 f/+;nes-cre (Het, right) mice pups at postnatal day 0 (P0); black arrows indicate cortex length and width. Scale bar: 2 mm. (b) Quantification of cortical length and width at P0, one-way ANOVA (WT: n = 16, KO: n = 7, and Het: n = 8 P0 brains; Length, P = 2.559E-05, F (2, 28) = 15.79; Width, P = 0.0869, F (2, 28) = 2.669) followed by Bonferroni’s post hoc test (Length, WT vs. KO, P = 4.358E-05, 95% confidence interval (C.I.) = 0.02383 to 0.06534, WT vs. Het, P = 0.9999, 95% C.I. = −0.02521 to 0.01446; Width, WT vs. KO, P = 0.2141, 95% C.I. = −0.008986 to 0.05154, WT vs. Het, P = 0.6633, 95% C.I. = −0.04098 to 0.01686). (c) Representative images of coronal sections of P0 brains stained with hematoxylin/eosin (H&E); black arrows indicate cortical thickness. Section shown in upper panel is from the same brain as the one below but ~1800 anterior to it. Scale bar: 1 mm. (d)Quantification of H&E staining, one-way ANOVA (n = 26 brain sections for all experimental groups; P = 2.9E-14, F (2, 75) = 48.61) followed by Bonferroni’s post hoc test (WT vs. KO, P = 4.9E-14, 95% C.I. = 170.1 to 279.4, WT vs. Het, P = 0.0678, 95% C.I. = −3.027 to 106.2). (e) Coronal sections of E17.5 brains stained with antibodies against Mettl14 and Pax6. Similar results were obtained from three independent experiments. (f) Coronal sections of E13.5, E15.5, E17.5, and P0 brains stained with anti-Mettl14 antibody. Similar results were obtained from three independent experiments. Scale bars: 100 μM. Graphs represent the mean ± SD. Dots represent data from individual data points. The horizontal lines in the boxplots indicate medians; the box limits indicate first and third quantiles; and the vertical whisker lines indicate minimum and maximum values. ns = non-significant. **** P < 0.0001.
Figure 2:
Figure 2:. Mettl14 regulates self-renewal of cortical NSCs from E14.5 brain in neurosphere culture.
(a) Two dimensional thin-layer chromatography (2D-TLC) analysis of m6A levels in Ribosome- depleted (Ribo-) PolyA RNAs isolated from in E14.5 NSCs after 7 days of neurosphere culture. Dashed blue circles indicate m6A spots. Similar results were obtained from three independent experiments. (b) Representative images of neurospheres formed from isolated E14.5 NSCs. (c) Quantification of neurosphere number and area, one-way ANOVA (n = 12 cell cultures for all experimental groups; area, P = 9.15E-13, F (2, 33) = 80.21; number, P = 0.0313, F (2, 33) = 3.853) followed by Bonferroni’s post hoc test (area, WT vs. KO, P = 3.2475E-11, 95% C.I. = 6781 to 10737, WT vs. Het, P = 0.2855, 95% C.I. = −2999 to 663.1; number, WT vs. KO, P = 0.0724, 95% C.I. = −0.5596 to 15.39, WT vs. Het, P = 0.9999, 95% C.I. = −9.31 to 6.643). (d) NSC growth curve. NSCs were plated at 200,000/well in 6-well plates and counted 2 and 4 days later, two-way ANOVA (n = 3 cell cultures for all experimental groups; P = 8.644E-12, F (2, 18) = 143.6) followed by Bonferroni’s post hoc test (WT vs. KO, P = 1.2905E-11, 95% C.I. = 4.133 to 5.666, WT vs. Het, P = 0.091, 95% C.I. = −0.09277 to 1.44). (e) Growth curve of Mettl14 KO and nondeleted control NSCs transduced with indicated vectors. NSCs were plated in 96-well plates, and numbers determined by MTT assay, two-way ANOVA (n = 3 cell cultures for all experimental groups; P = 1.413E-20, F (3, 24) = 396.9) followed by Bonferroni’s post hoc test (WT-vector vs. WT-FlagMettl14, P = 1.162E-08, 95% C.I. = 0.02849 to 0.0514, WT-vector vs. KO-vector, P = 1.77094E-20, 95% C.I. = 0.1213 to 0.1442, WT-vector vs. KO-FlagMettl14, P = 0.9999, 95% C.I. = −0.01183 to 0.01107). (f) Immunostaining for anti-Tuj1 in NSCs cultured 7 days in vitro. Scale bar: 100 μM. (g) Quantification of immunostaining, one-way ANOVA (n = 3 fields for all experimental groups; P = 0.0004, F (2, 6) = 38.49) followed by Bonferroni’s post hoc test (WT vs. KO, P = 0.0004, 95% C.I. = −85.13 to −38.65, WT vs. Het, P = 0.9999, 95% C.I. = −28.37 to 18.11). Graphs represent the mean ± SD. Dots represent data from individual data points. The horizontal lines in the boxplots indicate medians; the box limits indicate first and third quantiles; and the vertical whisker lines indicate minimum and maximum values. ns = non-significant. *** P < 0.001, **** P < 0.0001.
Figure 3:
Figure 3:. Mettl14 deficiency decreases RGC proliferation in vivo.
(a-c) Coronal sections of E17.5 brains stained with antibodies recognizing BrdU, PH3, and PAX6. Pregnant mothers received a BrdU pulse 30 min prior to embryo collection. (d) Quantification of immunostaining from E17.5 sections. Numbers of Pax6+, BrdU+ and PH3+ cells were determined and normalized to comparable sections from nondeleted mice, one-way ANOVA (n = 3 brain sections for all experimental groups; Pax6+, P = 0.0005, F (2, 6) = 34.41; BrdU+, P = 0.0231, F (2, 6) = 7.531; PH3+, P = 0.0002, F (2, 6) = 47.73) followed by Bonferroni’spost hoc test (Pax6+, WT vs. KO, P = 0.0004, 95% C.I. = 0.2814 to 0.6025, WT vs. Het, P = 0.0584, 95% C.I. = −0.006443 to 0.3146; BrdU+, WT vs. KO, P = 0.0194, 95% C.I. = 0.08378 to 0.7348, WT vs. Het, P = 0.7612, 95% C.I. = −0.2218 to 0.4292; PH3+, WT vs. KO, P = 0.0002, 95% C.I. = 0.2976 to 0.5796, WT vs. Het, P = 0.2287, 95% C.I. = −0.05332 to 0.2288). (e,f) Coronal sections of E15.5 (E) and E17.5 (F) brains stained with both anti-BrdU antibody that recognize BrdU only and anti-IdU antibody that also recognize BrdU. Pregnant mothers received one IdU injection, followed by one BrdU injection 1.5 hr later. After another 0.5 hr, the embryonic brains were collected for analysis. (g) Quantification of the percentage of IdU+BrdU- cells, representing cells left S phase during the 1.5 hr chase, among total IdU+ cells. One-way ANOVA (n = 3 brain sections for all experimental groups; E15.5, P = 0.0025, F (2, 6) = 19.21; E17.5, P = 0.0075, F (2, 6) = 12.35) followed by Bonferroni’s post hoc test (E15.5, WT vs. KO, P = 0.0067, 95% C.I. = 2.835 to 12.6, WT vs. Het, P = 0.5802, 95% C.I. = −6.787 to 2.973; E17.5, WT vs. KO, P = 0.0107, 95% C.I. = 2.347 to 13.19, WT vs. Het, P = 0.9999, 95% C.I. = −5.598 to 5.244). (h,i) Coronal sections of E15.5 (H) and E17.5 (I) brains stained with antibodies recognizing Ki67 and BrdU. Pregnant mothers received one BrdU injection 24 hour prior to embryo collection. (j) Quantification of the percentage of BrdU+Ki67- cells, representing cells exited cell cycle during 24 hour, among total BrdU+ cells. One-way ANOVA (n = 3 brain sections for all experimental groups; E15.5, P = 0.0173, F (2, 6) = 8.589; E17.5, P = 0.0016, F (2, 6) = 22.51) followed by Bonferroni’s post hoc test (E15.5, WT vs. KO, P = 0.014, 95% C.I. = 4.493 to 29.92, WT vs. Het, P = 0.6051, 95% C.I. = −7.885 to 17.54; E17.5, WT vs. KO, P = 0.01, 95% C.I. = 3.932 to 21.2, WT vs. Het, P = 0.1249, 95% C.I. = −15.28 to 1.99). (k,l) Immunostaining of coronal sections of E17.5 brain with antibodies to the intermediate progenitor marker anti-Tbr2 and the proneural marker anti-Neurod2. Dashed white lines indicate border of VZ/SVZ area. Similar results were obtained from three independent experiments. Scale bars: 100 μM. Graphs represent the mean ± SD. Dots represent data from individual data points. ns = non-significant. * P < 0.05, ** P < 0.01, *** P < 0.001.
Figure 4:
Figure 4:. Mettl14 deficiency decreases number of late-born neurons.
(a) Coronal sections of P0 brains stained with the layer II-IV marker Cux1, the layer V marker Sox5, and the layer VI/subplate (SP) marker Tbr1. Dashed white lines mark borders of Cux1+ and Sox5+ neuronal layers. (b) Quantification of thickness of Cux1+, Sox5+, or Tbr1+ neuronal layers, one-way ANOVA (n = 3 brain sections for all experimental groups; Cux1+, P = 2.689E-07, F (2, 6) = 461.8; Sox5+, P = 0.115, F (2, 6) = 3.169; Tbr1+, P = 0.8865, F (2, 6) = 0.1229) followed by Bonferroni’spost hoc test (Cux1+, WT vs. KO, P = 4E-07, 95% C.I. = 84.39 to 105.9, WT vs. Het, P = 0.9999, 95% C.I. = −10.97 to 10.52; Sox5+, WT vs. KO, P = 0.1329, 95% C.I. = −14.18 to 101.2, WT vs. Het, P = 0.9999, 95% C.I. = −55.32 to 60.06; Tbr1+, WT vs. KO, P = 0.9999, 95% C.I. = −43.31 to 46.59, WT vs. Het, P = 0.9999, 95% C.I. = −50.47 to 39.42). (c) Coronal sections of P0 brains stained with the layer II-IV marker Satb2. (d) Quantification of number of Satb2+ cells, one-way ANOVA (n = 3 brain sections for all experimental groups; P = 0.00015, F (2, 6) = 53.83) followed by Bonferroni’s post hoc test (WT vs. KO, P = 0.0003, 95% C.I. = 198.2 to 408.5, WT vs. Het, P = 0.9186, 95% C.I. = −133.1 to 77.14). (e) Coronal sections of E17.5 brains stained with Cux1; dashed white lines mark border of Cux1+ neuronal layer. (f) Quantification of Cux1+ layer thickness within dashed white lines and of the average number of newly generated Cux1+ cells within 1 mm2, as measured from the VZ to the lower dashed white lines, at E17.5. One-way ANOVA (n = 3 brain sections for all experimental groups; thickness, P = 0.0019, F (2, 6) = 21.36; number, P = 0.0004, F (2, 6) = 36.75) followed by Bonferroni’s post hoc test (thickness, WT vs. KO, P = 0.0025, 95% C.I. = 9.765 to 30.85, WT vs. Het, P = 0.9999, 95% C.I. = −10.13 to 10.96; number, WT vs. KO, P = 0.0004, 95% C.I. = 181.5 to 401.9, WT vs. Het, P = 0.7499, 95% C.I. = −74.64 to 145.8). Scale bars: 200 μM. Graphs represent the mean ± SD. Dots represent data from individual data points. ns = non-significant. ** P < 0.01, *** P < 0.001, **** P < 0.0001.
Figure 5:
Figure 5:. m6A regulates NSC gene expression through histone modifications.
(a) Heat map analysis based on RNA-seq analysis in Mettl14 KO vs. nondeleted control NSCs. (b,c) Gene ontology (GO) analysis of genes down- and up-regulated in Mettl14 KO vs. nondeleted control E14.5 NSCs. GO analysis were performed by DAVID. Differentially expressed genes had an adjusted P < 0.01 and a 2-fold or greater expression difference. Among differentially expressed genes, 1099 are up-regulated and 1487 are down -regulated. Numbers of gene counts and exact P values for each GO term are listed in Supplementary Fig. 4a. (e) Representative western blots of acid-extracted histones from E14.5 NSCs using antibodies recognizing H3K4–1me, H3K4–3me, H3K27–3me, H3K9–3me, H3K27-ac, H3K9-ac, pan-acetyl- H3, uH2AK119, uH2BK120, and H3S28 phosphorylation. The band sizes range from 17 to 23 KD as expected for modified histones. For uncropped images, see Supplementary Fig. 6a. (f) Quantitation of western blots from E14.5 and E17.5 NSCs, one-way ANOVA (WT: n = 8, KO: n = 12, and Het: n = 8 independent NSCs cultures; H3K4me1, P = 0.1123, F (2, 25) = 2.39; H3K4me3, P = 1.06442E-09, F (2, 25) = 52.77; H3K9me3, P = 0.2096, F (2, 25) = 1.664; H3K27me3, P = 0.00013, F (2, 25) = 13.07; H3K9ac, P = 0.1461, F (2, 25) = 2.08; H3K27ac, P = 4.796E-06, F (2, 25) = 20.8; H3ac, P = 0.3676, F (2, 25) = 1.042; H2AK119Ubi, P = 0.3592, F (2, 25) = 1.067; H2BK120Ubi, P = 0.1192, F (2, 25) = 2.319; H3S28pho, P = 0.5347, F (2, 25) = 0.642) followed by Bonferroni’ spost hoc test (H3K4me1, WT vs. KO, P = 0.2376, 95% C.I. = - 0.4713 to 0.09065, WT vs. Het, P = 0.9999, 95% C.I. = −0.2629 to 0.3527; H3K4me3, WT vs. KO, P = 1.157E-08, 95% C.I. = −0.5518 to −0.3128, WT vs. Het, P = 0.9999, 95% C.I. = −0.134 to 0.1278; H3K9me3, WT vs. KO, P = 0.4574, 95% C.I. = −0.3314 to 0.1054, WT vs. Het, P = 0.9999, 95% C.I. = −0.1942 to 0.2842; H3K27me3, WT vs. KO, P = 0.0008, 95% C.I. = −1.131 to −0.2956, WT vs. Het, P = 0.9999, 95% C.I. = −0.3891 to 0.5256; H3K9ac, WT vs. KO, P = 0.321, 95% C.I. = −0.4577 to 0.1121, WT vs. Het, P = 0.1141, 95% C.I. = −0.5732 to 0.05098; H3K27ac, WT vs. KO, P = 1.769E-05, 95% C.I. = −1.591 to −0.6358, WT vs. Het, P = 0.9999, 95% C.I. = −0.5908 to 0.4556; H3ac, WT vs. KO, P = 0.6463, 95% C.I. = −0.4945 to 0.2007, WT vs. Het, P = 0.9999, 95% C.I. = −0.3309 to 0.4307; H2AK119Ubi, WT vs. KO, P = 0. 5288, 95% C.I. = −0.1242 to 0.3523, WT vs. Het, P = 0.9999, 95% C.I. = −0.2759 to 0.2459; H2BK120Ubi, WT vs. KO, P = 0.6171, 95% C.I. = −0.2165 to 0.5511, WT vs. Het, P = 0.6457, 95% C.I. = - 0.5982 to 0.2426; H3S28pho, WT vs. KO, P = 0.9999, 95% C.I. = −0.2407 to 0.2961, WT vs. Het, P = 0.8731, 95% C.I. = −0.3915 to 0.1965). (f) Cell growth analysis based on an MTT assay of NSCs treated with vehicle/DMSO or the MLL1 inhibitor MM-102, the CBP/P300 inhibitor C646, or the Ezh2 inhibitor GSK343. Shown is the absorbance ratio of KO to non-deleted controls at each drug dose. One-way ANOVA (n = 3 independent experiments for all experimental groups; GSK343, P = 4.232E-05, F (3, 8) = 38.47; C646, P = 0.0003, F (3, 8) = 23.43; MM-102, P = 0.0025, F (3, 8) = 11.91) followed by Bonferroni’s post hoc test (GSK343, c vs. 1.25, P = 0.0035, 95% C.I. = −0.2477 to −0.05943, c vs. 2.5, P = 0.0002, 95% C.I. = −0.3265 to −0.1383, c vs. 5, P = 1.979E-05, 95% C.I. = −0.4169 to - 0.2287; C646, c vs. 1.25, P = 0.0036, 95% C.I. = −0.1158 to −0.02744, c vs. 2.5, P = 0.0236, 95% C.I. = −0.09574 to −0.007344, c vs. 5, P = 0.000103, 95% C.I. = −0.1654 to −0.07702; MM-102, c vs. 0.0625, P = 0.0507, 95% C.I. = −8.591E-05 to 0.06086, c vs. 1.25, P = 0.9999, 95% C.I. = - 0.03858 to 0.02237, c vs. 2.5, P = 0.0615, 95% C.I. = −0.05958 to 0.001368). Graphs represent the mean ± SD. Dots represent data from individual data points. ns = nonsignificant. * P < 0.05, ** P < 0.01, *** P < 0.001, **** P < 0.0001.
Figure 6:
Figure 6:. H3K27-ac inhibitor C646 and H3K27-me3 inhibitor GSK343 rescue aberrant gene expression in KO vs. nondeleted NSCs.
(a) H3K27ac ChIP-qPCR showing increased promoter / enhancer H3K27ac of Kif26a, Gas7, and Pdgfrb genes in E14.5 Mettl14 KO vs. nondeleted NSCs. n = 4 independent experiments for all experimental groups, two-tailed unpaired t-test (Kif26a, P = 0.0006, t = 6.568, df = 6, 95% C.I. = 9.594 to 20.99; Gas7, P = 0.00013, t = 8.638, df = 6, 95% C.I. = 17.41 to 31.16; Pdgfrb, P = 0.0002, t = 8.395, df = 6, 95% C.I. = 9.27 to 16.9). (b) RT-qPCR showing increased expression of Kif26a, Gas7, and Pdgfrb genes in E14.5 Mettl14 KO vs. nondeleted NSCs. n = 3 independent experiments for all experimental groups, two-tailed unpaired t-test (Kif26a, P = 0.0002, t = 12.71, df = 4, 95% C.I. = 25.01 to 38.99; Gas7, P = 0.0002, t = 12.46, df = 4, 95% C.I. = 11.41 to 17.95; Pdgfrb, P = 0.0008, t = 9.08, df = 4, 95% C.I. = 2.957 to 5.563). (c) RT-qPCR showing decreased expression of Kif26a, Gas7, and Pdgfrb genes in E14.5 Mettl14 KO vs. nondeleted NSCs treated with H3K27ac inhibitor C646. One-way ANOVA (n = 3 independent experiments for all experimental groups; Kif26a, P = 0.0015, F (2, 6) = 23.04; Gas7, P = 0.0027, F (2, 6) = 18.67; Pdgfrb, P = 8.449E-07, F (2, 6) = 314.3) followed by Bonferroni’ spost hoc test (Kif26a, c vs. 0.625, P = 0.0041, 95% C.I. = 6.126 to 22.47, c vs. 1.25, P = 0.0014, 95% C.I. = 9.393 to 25.73; Gas7, c vs. 0.625, P = 0.045, 95% C.I. = 0.05735 to 4.229, c vs. 1.25, P = 0.0018, 95% C.I. = 2.207 to 6.379; Pdgfrb, c vs. 0.625, P = 1.431E-05, 95% C.I. = 1.75 to 2.663, c vs. 1.25, P = 5.418E-07, 95% C.I. = 3.384 to 4.296). (d) H3K27–3me ChIP-qPCR showing increased H3K27–3me at promoters of Egr2 and Egr3 genes in E14.5 Mettl14 KO vs. nondeleted NSCs. n = 4 independent experiments for all experimental groups, two-tailed unpaired t-test (Egr2, P = 0.0016, t = 5.463, df = 6, 95% C.I. = 5.412 to 14.19; Egr3, P = 0.0010, t = 5.928, df = 6, 95% C.I. = 5.007 to 12.05). (e) RT-qPCR showing decreased expression of Egr2 and Egr3 genes in E14.5 Mettl14 KO vs. nondeleted NSCs. n = 3 independent experiments for all experimental groups, two-tailed unpaired t-test (Egr2, P = 0.0052, t = 5.603, df = 4, 95% C.I. = −0.3789 to −0.1278; Egr3, P = 0.0009, t = 10.67, df = 4, 95% C.I. = −0.7855 to −0.4612). (f) RT-qPCR showing increased expression of Egr2 and Egr3 genes in E14.5 Mettl14 KO vs. nondeleted NSCs treated with H3K27–3me inhibitor GSK343. One-way ANOVA (n = 3 independent experiments for all experimental groups; Egr2, P = 0.0003, F (2, 6) = 44.49; Egr3, P = 0.01, F (2, 6) = 10.94) followed by Bonferroni’spost hoc test (Egr2, c vs. 0.625, P = 0.0007, 95% C.I. = −0.4826 to −0.2041, c vs. 1.25, P = 0.0002, 95% C.I. = −0.5526 to −0.2741; Egr3, c vs. 0.625, P = 0.0519, 95% C.I. = −0.5627 to 0.002676, c vs. 1.25, P = 0.0072, 95% C.I. = −0.7227 to −0.1573). Graphs represent the mean ± SD. Dots represent data from individual data points. ns = non-significant. * P < 0.05, ** P < 0.01, *** P < 0.001, **** P < 0.0001.
Figure 7:
Figure 7:. m6A regulates mRNA stability of CBP and p300.
(a) m6A-meRIP-qPCR of CBP and p300 in Mettl14 KO vs. control E14.5 NSCs. One-way ANOVA (n = 3 independent experiments for all experimental groups; CBP, P = 1.08E-06, F (2, 6) = 289.4; p300, P = 3.961E-07, F (2, 6) = 405.5) followed by Bonferroni’ spost hoc test (CBP, WT vs. KO, P = 1.697E-06, 95% C.I. = 16.18 to 21.63, WT vs. Het, P = 0.9999, 95% C.I. = - 3.13 to 2.316; p300, WT vs. KO, P = 1.113E-06, 95% C.I. = 21.47 to 28.12, WT vs. Het, P = 0.0086, 95% C.I. = −8.32 to −1.667). (b) RT-qPCR of CBP and p300 transcripts in E14.5 NSCs cultured for 7 days in vitro, one-way ANOVA (WT: n = 21, KO: n = 33, and Het: n = 21 independent experiments for all experimental groups; CBP, P = 2.380E-21, F (2, 72) = 98.64; p300, P = 2.751E-09, F (2, 72) = 26.24) followed by Bonferroni’ spost hoc test (CBP, WT vs. KO, P = 1.306E-19, 95% C.I. = - 1.252 to −0.8628, WT vs. Het, P = 0.3029, 95% C.I. = −0.3512 to 0.07886; p300, WT vs. KO, P = 5.254E-09, 95% C.I. = −0.6356 to −0.3153, WT vs. Het, P = 0.2011, 95% C.I. = −0.3058 to 0.04839). (c) RT-qPCR of CBP and p300 transcripts in Actinomycin D-treated E14.5 NSCs. P values are generated by two-way ANOVA (n = 3 independent experiments for all experimental groups; CBP, P = 1.262E-11, F (1, 12) = 602.5; p300, P = 8.738E-10, F (1, 12) = 291.7) followed by Bonferroni’ spost hoc test (CBP, 0 h, P = 0.9999, 95% C.I. = −0.05658 to 0.05658, 3 h, P = 1.714E-08, 95% C.I. = −0.3518 to −0.2386, 6 h, P = 7.954E-12, 95% C.I. = −0.6268 to −0.5136; p300, 0 h, P = 0.9999, 95% C.I. = −0.06777 to 0.06777, 3 h, P = 1.988E-07, 95% C.I. = −0.3522 to −0.2167, 6 h, P = 1.50564E-09, 95% C.I. = −0.5046 to −0.3691). (d) A model whereby m6A loss alters histone modifications partly through regulating mRNA stability of histone modifiers, and altered histone modifications aberrantly repress proliferation- related genes and activate differentiation-related genes resulting in loss of NSC ground state. Graphs represent the mean ± SD. Dots represent data from individual data points. The horizontal lines in the boxplots indicate medians; the box limits indicate first and third quantiles; and the vertical whisker lines indicate minimum and maximum values. **** P < 0.0001.

References

    1. Meyer KD et al. Comprehensive analysis of mRNA methylation reveals enrichment in 3’ UTRs and near stop codons. Cell 149, 1635–46 (2012). - PMC - PubMed
    1. Dominissini D et al. Topology of the human and mouse m6A RNA methylomes revealed by m6A-seq. Nature 485, 201–6 (2012). - PubMed
    1. Liu J et al. A METTL3-METTL14 complex mediates mammalian nuclear RNA N6- adenosine methylation. Nat Chem Biol 10, 93–5 (2014). - PMC - PubMed
    1. Wang Y et al. N6-methyladenosine modification destabilizes developmental regulators in embryonic stem cells. Nature cell biology 16, 191–8 (2014). - PMC - PubMed
    1. Sledz P & Jinek M Structural insights into the molecular mechanism of the m(6)A writer complex. Elife 5(2016). - PMC - PubMed

Publication types

MeSH terms