

Senescence chips for ultrahigh-throughput isolation and removal of senescent cells
- PMID: 29336105
- PMCID: PMC5847876
- DOI: 10.1111/acel.12722
Senescence chips for ultrahigh-throughput isolation and removal of senescent cells
Abstract
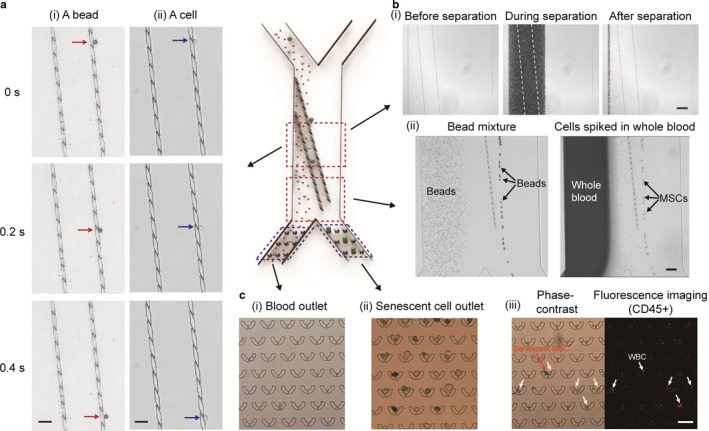
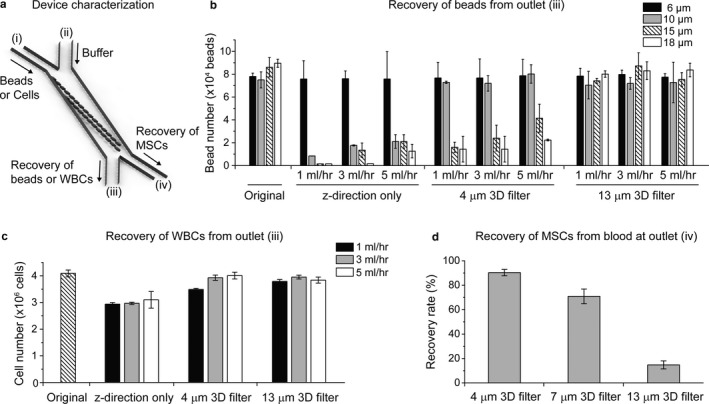
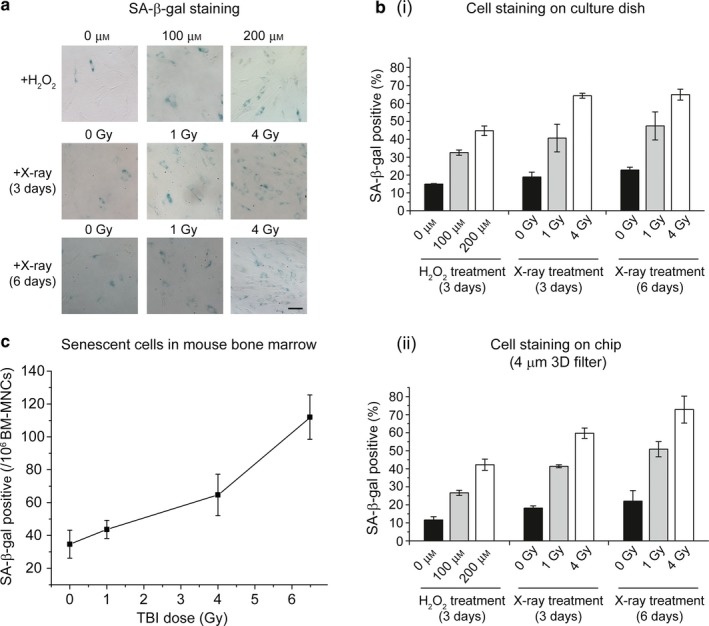
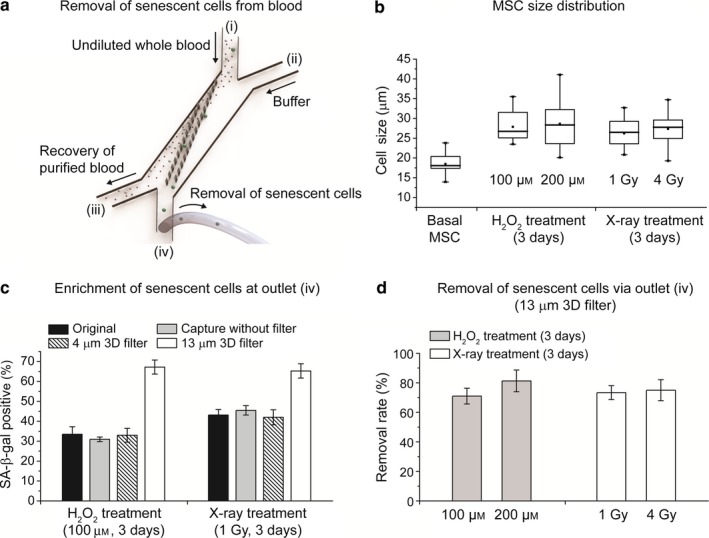
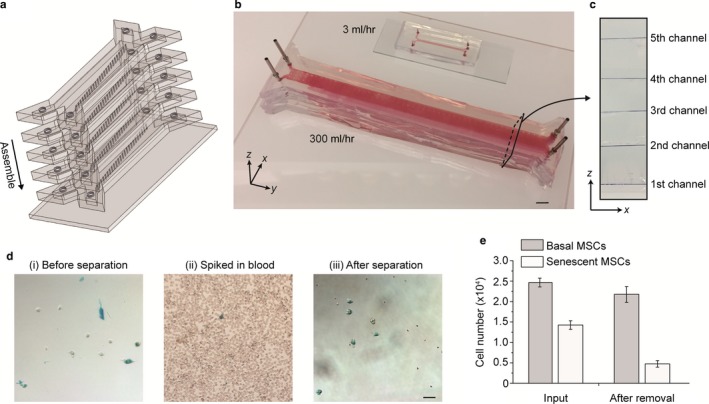
Cellular senescence plays an important role in organismal aging and age-related diseases. However, it is challenging to isolate low numbers of senescent cells from small volumes of biofluids for downstream analysis. Furthermore, there is no technology that could selectively remove senescent cells in a high-throughput manner. In this work, we developed a novel microfluidic chip platform, termed senescence chip, for ultrahigh-throughput isolation and removal of senescent cells. The core component of our senescence chip is a slanted and tunable 3D micropillar array with a variety of shutters in the vertical direction for rapid cell sieving, taking advantage of the characteristic cell size increase during cellular senescence. The 3D configuration achieves high throughput, high recovery rate, and device robustness with minimum clogging. We demonstrated proof-of-principle applications in isolation and enumeration of senescent mesenchymal stem cells (MSCs) from undiluted human whole blood, and senescent cells from mouse bone marrow after total body irradiation, with the single-cell resolution. After scale-up to a multilayer and multichannel structure, our senescence chip achieved ultrahigh-throughput removal of senescent cells from human whole blood with an efficiency of over 70% at a flow rate of 300 ml/hr. Sensitivity and specificity of our senescence chips could be augmented with implementation of multiscale size separation, and identification of background white blood cells using their cell surface markers such as CD45. With the advantages of high throughput, robustness, and simplicity, our senescence chips may find wide applications and contribute to diagnosis and therapeutic targeting of cellular senescence.
Keywords: anti-aging; cellular senescence; mesenchymal stem cells; microfluidic chip; size separation; total body irradiation.
© 2018 The Authors. Aging Cell published by the Anatomical Society and John Wiley & Sons Ltd.
Figures

Similar articles
-
ViaChip for Size-based Enrichment of Viable Cells.Sens Actuators B Chem. 2022 Feb 15;353:131159. doi: 10.1016/j.snb.2021.131159. Epub 2021 Nov 26. Sens Actuators B Chem. 2022. PMID: 34975229 Free PMC article.
-
Characterization of Induction and Targeting of Senescent Mesenchymal Stromal Cells.Tissue Eng Part C Methods. 2022 Jun;28(6):239-249. doi: 10.1089/ten.TEC.2022.0048. Tissue Eng Part C Methods. 2022. PMID: 35438548 Free PMC article.
-
Quantifying Senescence-Associated Phenotypes in Primary Multipotent Mesenchymal Stromal Cell Cultures.Methods Mol Biol. 2019;2045:93-105. doi: 10.1007/7651_2019_217. Methods Mol Biol. 2019. PMID: 31020633
-
Transcriptomic Analysis of Cellular Senescence: One Step Closer to Senescence Atlas.Mol Cells. 2021 Mar 31;44(3):136-145. doi: 10.14348/molcells.2021.2239. Mol Cells. 2021. PMID: 33795532 Free PMC article. Review.
-
Rejuvenation of Senescent Mesenchymal Stem Cells to Prevent Age-Related Changes in Synovial Joints.Cell Transplant. 2023 Jan-Dec;32:9636897231200065. doi: 10.1177/09636897231200065. Cell Transplant. 2023. PMID: 37766590 Free PMC article. Review.
Cited by
-
Senescent mesenchymal stem/stromal cells and restoring their cellular functions.World J Stem Cells. 2020 Sep 26;12(9):966-985. doi: 10.4252/wjsc.v12.i9.966. World J Stem Cells. 2020. PMID: 33033558 Free PMC article. Review.
-
The role of titanium surface micromorphology in MG-63 cell motility during osteogenesis.Sci Rep. 2022 Jun 15;12(1):9971. doi: 10.1038/s41598-022-13854-2. Sci Rep. 2022. PMID: 35705640 Free PMC article.
-
In-drop thermal cycling of microcrystal assembly for senescence control (MASC) with minimal variation in efficacy.Adv Funct Mater. 2023 Sep 12;33(37):2302232. doi: 10.1002/adfm.202302232. Epub 2023 May 1. Adv Funct Mater. 2023. PMID: 37901180 Free PMC article.
-
Recent Advances in Senotherapeutics Delivery.Tissue Eng Part B Rev. 2022 Dec;28(6):1223-1234. doi: 10.1089/ten.TEB.2021.0212. Epub 2022 Jul 12. Tissue Eng Part B Rev. 2022. PMID: 35451328 Free PMC article. Review.
-
WNT/beta-catenin signalling interrupts a senescence-induction cascade in human mesenchymal stem cells that restricts their expansion.Cell Mol Life Sci. 2022 Jan 20;79(2):82. doi: 10.1007/s00018-021-04035-x. Cell Mol Life Sci. 2022. PMID: 35048158 Free PMC article.
References
-
- Baker, D. J. , Childs, B. G. , Durik, M. , Wijers, M. E. , Sieben, C. J. , Zhong, J. , … van Deursen, J. M. (2016). Naturally occurring p16(Ink4a)‐positive cells shorten healthy lifespan. Nature, 530, 184–189. https://doi.org/10.1038/nature16932 - DOI - PMC - PubMed
-
- Campisi, J. , & d'Adda di Fagagna, F. (2007). Cellular senescence: When bad things happen to good cells. Nature Reviews Molecular Cell Biology, 8, 729–740. https://doi.org/10.1038/nrm2233 - DOI - PubMed
-
- Cashen, A. F. , Link, D. , Devine, S. , & DiPersio, J. (2004). Cytokines and stem cell mobilization for autologous and allogeneic transplantation. Current Hematology Reports, 3, 406–412. - PubMed
Publication types
MeSH terms
Grants and funding
- R43 AG046025/AG/NIA NIH HHS/United States
- R43 GM109682/GM/NIGMS NIH HHS/United States
- R44 ES023529/ES/NIEHS NIH HHS/United States
- R43 AI106100/AI/NIAID NIH HHS/United States
- R43 AT008297/AT/NCCIH NIH HHS/United States
- R43 ES022360/ES/NIEHS NIH HHS/United States
- R44 AT008297/AT/NCCIH NIH HHS/United States
- R44 GM109682/GM/NIGMS NIH HHS/United States
- R44 ES022360/ES/NIEHS NIH HHS/United States
- R44 AG046025/AG/NIA NIH HHS/United States
- R43 ES023529/ES/NIEHS NIH HHS/United States
- R44 AI106100/AI/NIAID NIH HHS/United States
- HHSN261201300033C/CA/NCI NIH HHS/United States
LinkOut - more resources
Full Text Sources
Other Literature Sources
Molecular Biology Databases
Research Materials
Miscellaneous
