

Clinical Utility of Fetal Short-Lag Spatial Coherence Imaging
- PMID: 29336851
- PMCID: PMC5827926
- DOI: 10.1016/j.ultrasmedbio.2017.12.006
Clinical Utility of Fetal Short-Lag Spatial Coherence Imaging
Abstract
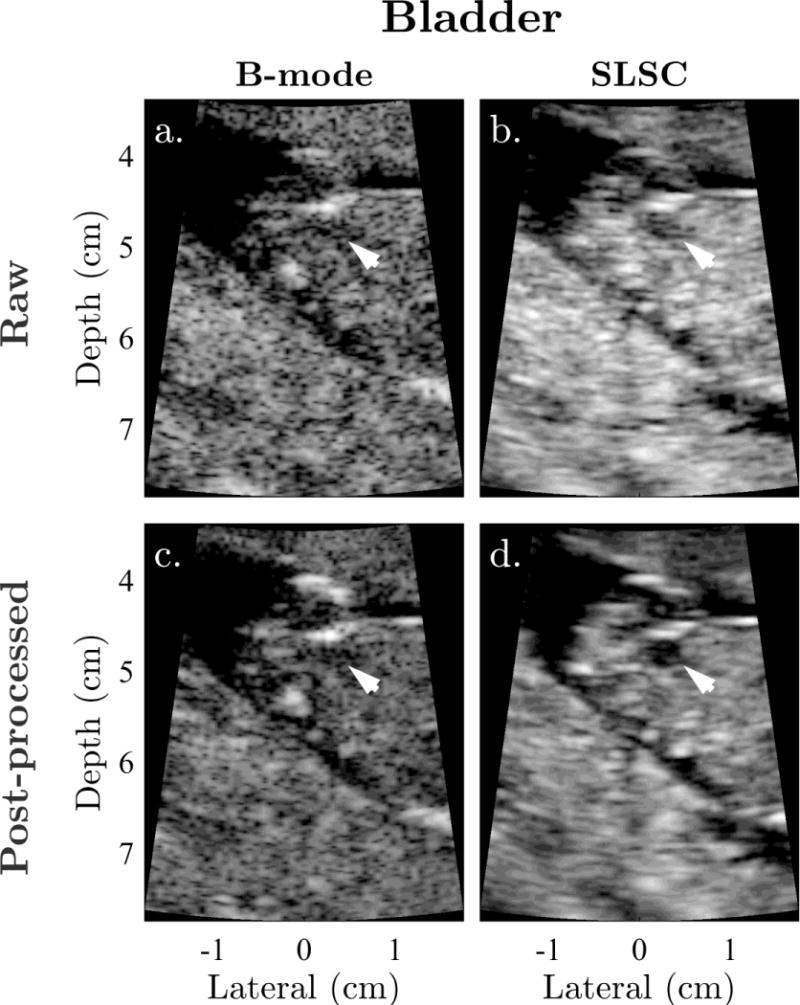
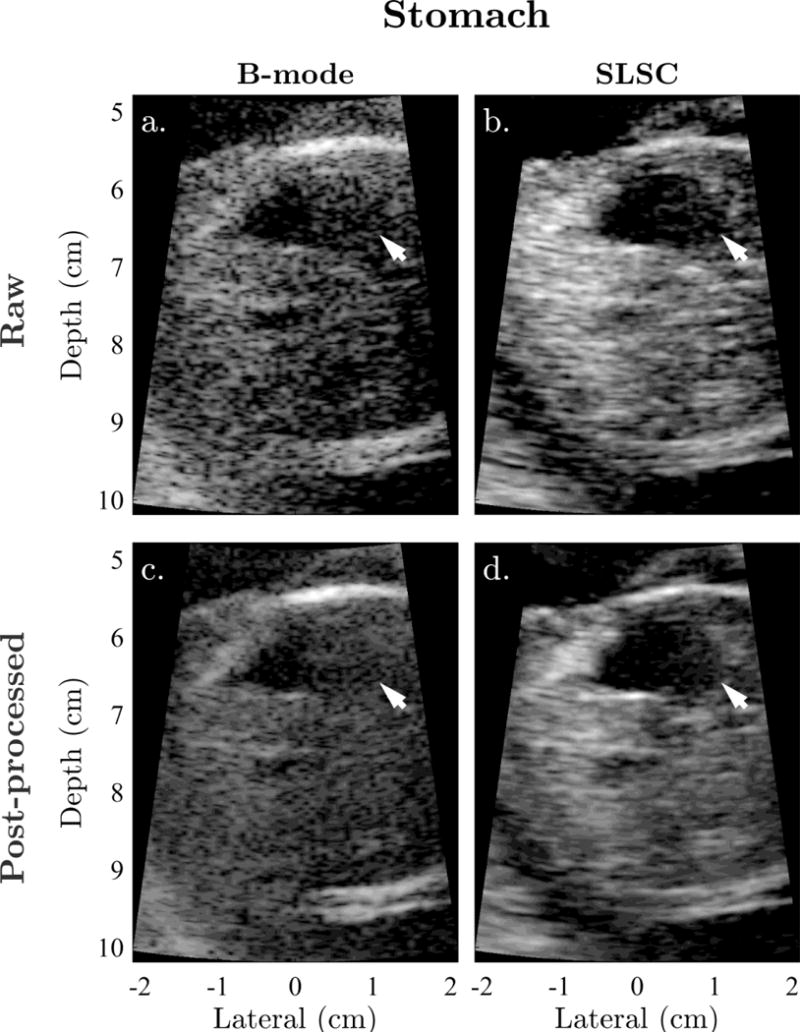
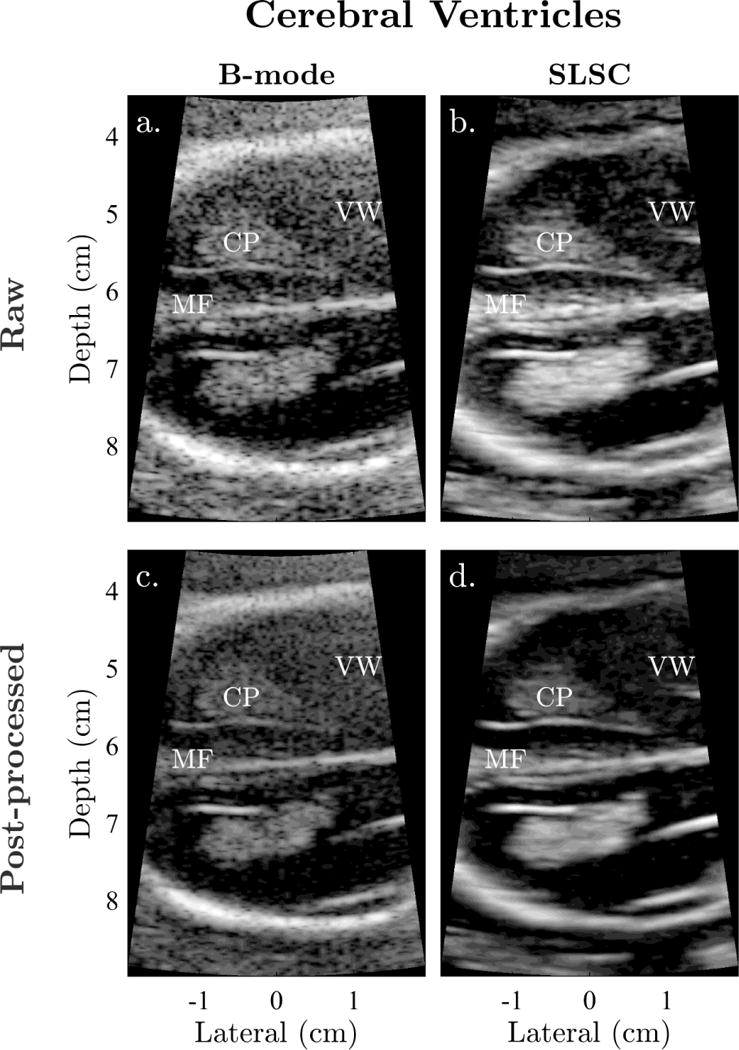
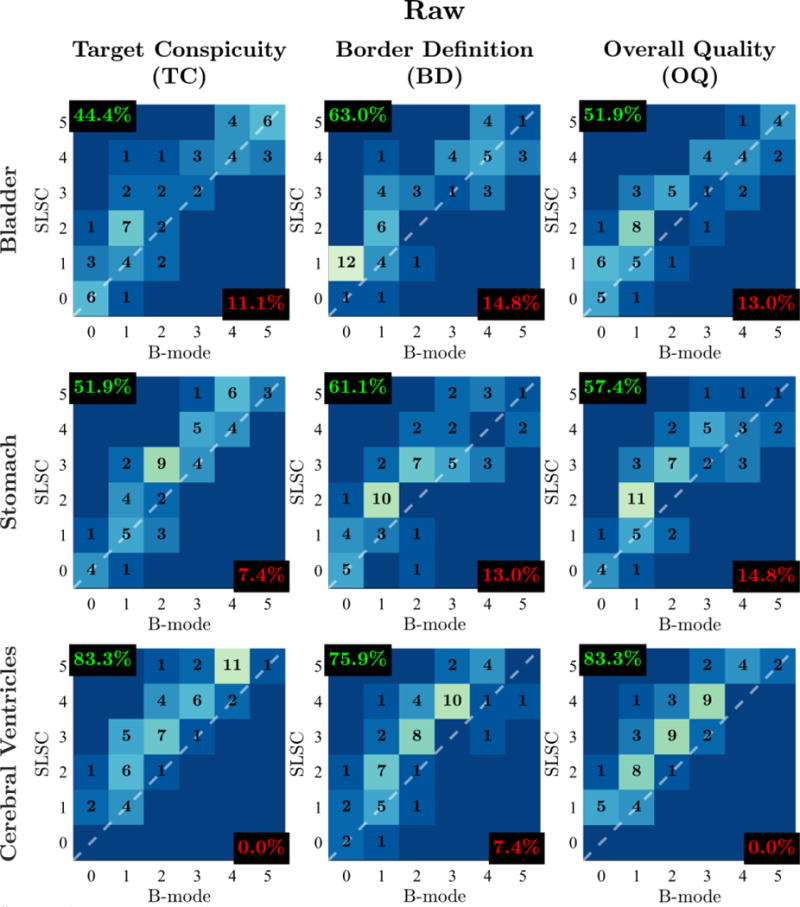
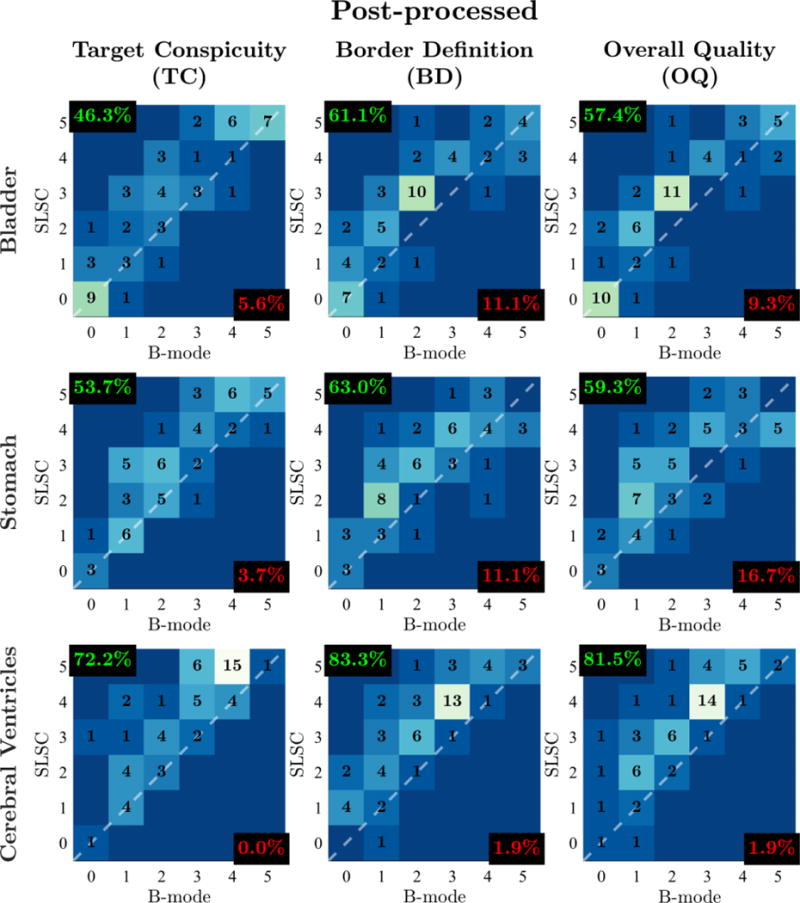
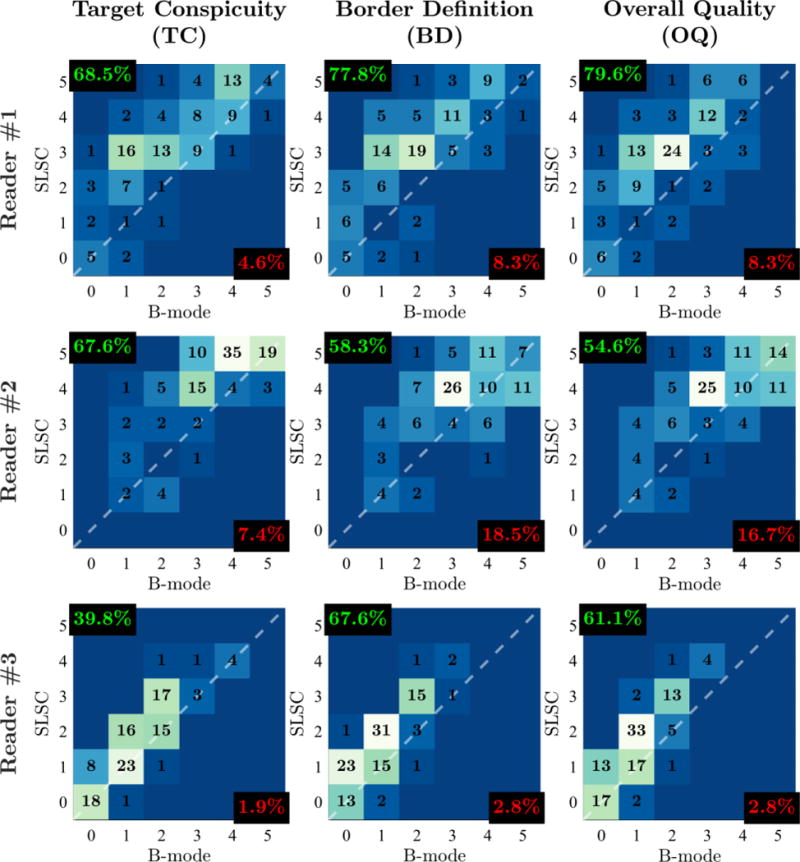
In this study, we evaluate the clinical utility of fetal short-lag spatial coherence (SLSC) imaging. Previous work has documented significant improvements in image quality with fetal SLSC imaging as quantified by measurements of contrast and contrast-to-noise ratio (CNR). The objective of this study was to examine whether this improved technical efficacy is indicative of the clinical utility of SLSC imaging. Eighteen healthy volunteers in their first and second trimesters of pregnancy were scanned using a modified Siemens SC2000 clinical scanner. Raw channel data were acquired for routinely examined fetal organs and used to generate fully matched raw and post-processed harmonic B-mode and SLSC image sequences, which were subsequently optimized for dynamic range and other imaging parameters by a blinded sonographer. Optimized videos were reviewed in matched B-mode and SLSC pairs by three blinded clinicians who scored each video based on overall quality, target conspicuity and border definition. SLSC imaging was highly favored over conventional imaging with SLSC scoring equal to (28.2 ± 10.5%) or higher than (63.9 ± 12.9%) B-mode for video pairs across all examined structures and processing conditions. Multivariate modeling revealed that SLSC imaging is a significant predictor of improved image quality with p ≤ 0.002. Expert-user scores for image quality support the application of SLSC in fetal ultrasound imaging.
Keywords: Beamforming; Clutter reduction; Fetal sonography; Harmonic imaging; Image quality; Reader study; Spatial coherence.
Copyright © 2018 World Federation for Ultrasound in Medicine and Biology. Published by Elsevier Inc. All rights reserved.
Figures

Similar articles
-
In vivo application of short-lag spatial coherence and harmonic spatial coherence imaging in fetal ultrasound.Ultrason Imaging. 2015 Apr;37(2):101-16. doi: 10.1177/0161734614547281. Epub 2014 Aug 12. Ultrason Imaging. 2015. PMID: 25116292 Free PMC article.
-
Short-lag Spatial Coherence Ultrasound Imaging with Adaptive Synthetic Transmit Aperture Focusing.Ultrason Imaging. 2017 Jul;39(4):224-239. doi: 10.1177/0161734616688328. Epub 2017 Jan 9. Ultrason Imaging. 2017. PMID: 28068874
-
Robust Short-Lag Spatial Coherence Imaging.IEEE Trans Ultrason Ferroelectr Freq Control. 2018 Mar;65(3):366-377. doi: 10.1109/TUFFC.2017.2780084. IEEE Trans Ultrason Ferroelectr Freq Control. 2018. PMID: 29505405 Free PMC article.
-
Ultrasound Fetal Image Segmentation Techniques: A Review.Curr Med Imaging Rev. 2019;15(1):52-60. doi: 10.2174/1573405613666170622115527. Curr Med Imaging Rev. 2019. PMID: 31964327 Review.
-
Two-Dimensional Speckle Tracking of the Fetal Heart: A Practical Step-by-Step Approach for the Fetal Sonologist.J Ultrasound Med. 2016 Aug;35(8):1765-81. doi: 10.7863/ultra.15.08060. Epub 2016 Jun 27. J Ultrasound Med. 2016. PMID: 27353066 Review.
Cited by
-
MimickNet, Mimicking Clinical Image Post- Processing Under Black-Box Constraints.IEEE Trans Med Imaging. 2020 Jun;39(6):2277-2286. doi: 10.1109/TMI.2020.2970867. Epub 2020 Jan 31. IEEE Trans Med Imaging. 2020. PMID: 32012003 Free PMC article.
-
CohereNet: A Deep Learning Architecture for Ultrasound Spatial Correlation Estimation and Coherence-Based Beamforming.IEEE Trans Ultrason Ferroelectr Freq Control. 2020 Dec;67(12):2574-2583. doi: 10.1109/TUFFC.2020.2982848. Epub 2020 Nov 24. IEEE Trans Ultrason Ferroelectr Freq Control. 2020. PMID: 32203018 Free PMC article.
-
Incoherent Clutter Suppression Using Lag-One Coherence.IEEE Trans Ultrason Ferroelectr Freq Control. 2020 Aug;67(8):1544-1557. doi: 10.1109/TUFFC.2020.2977200. Epub 2020 Feb 28. IEEE Trans Ultrason Ferroelectr Freq Control. 2020. PMID: 32142428 Free PMC article.
-
Reverberation Clutter Suppression Using 2-D Spatial Coherence Analysis.IEEE Trans Ultrason Ferroelectr Freq Control. 2022 Jan;69(1):84-97. doi: 10.1109/TUFFC.2021.3108059. Epub 2021 Dec 31. IEEE Trans Ultrason Ferroelectr Freq Control. 2022. PMID: 34437060 Free PMC article.
-
Human Observer Sensitivity to Temporal Noise During B-Mode Ultrasound Scanning: Characterization and Imaging Implications.Ultrason Imaging. 2024 May;46(3):151-163. doi: 10.1177/01617346241236160. Epub 2024 Mar 18. Ultrason Imaging. 2024. PMID: 38497455 Free PMC article.
References
-
- ACOG. Practice bulletin no. 101: Ultrasonography in pregnancy. Obstetrics and gynecology. 2009;113:451. - PubMed
-
- Bennett KA, Crane JM, O’Shea P, Lacelle J, Hutchens D, Copel JA. First trimester ultrasound screening is effective in reducing postterm labor induction rates: a randomized controlled trial. American journal of obstetrics and gynecology. 2004;190:1077–1081. - PubMed
-
- Berson M, Roncin A, Pourcelot L. Compound scanning with an electrically steered beam. Ultrasonic imaging. 1981;3:303–308.
Publication types
MeSH terms
Grants and funding
LinkOut - more resources
Full Text Sources
Other Literature Sources
