. 2018 Feb 8;172(4):825-840.e18.
doi: 10.1016/j.cell.2017.12.026. Epub 2018 Jan 11.

LXR/ApoE Activation Restricts Innate Immune Suppression in Cancer

Affiliations

LXR/ApoE Activation Restricts Innate Immune Suppression in Cancer

Masoud F Tavazoie et al. Cell. .

Abstract

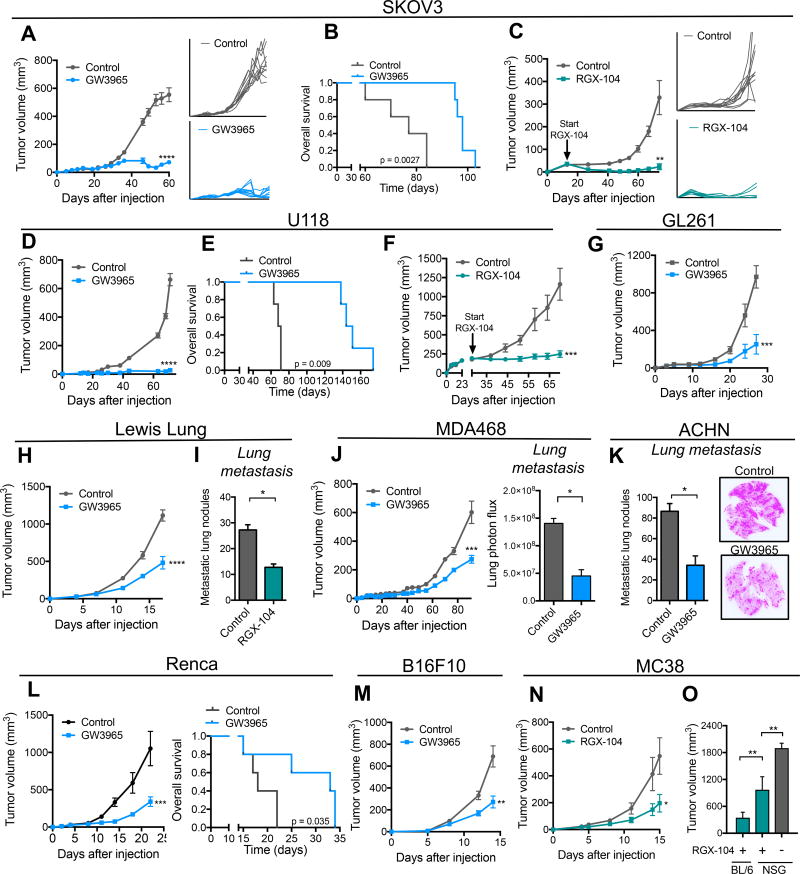
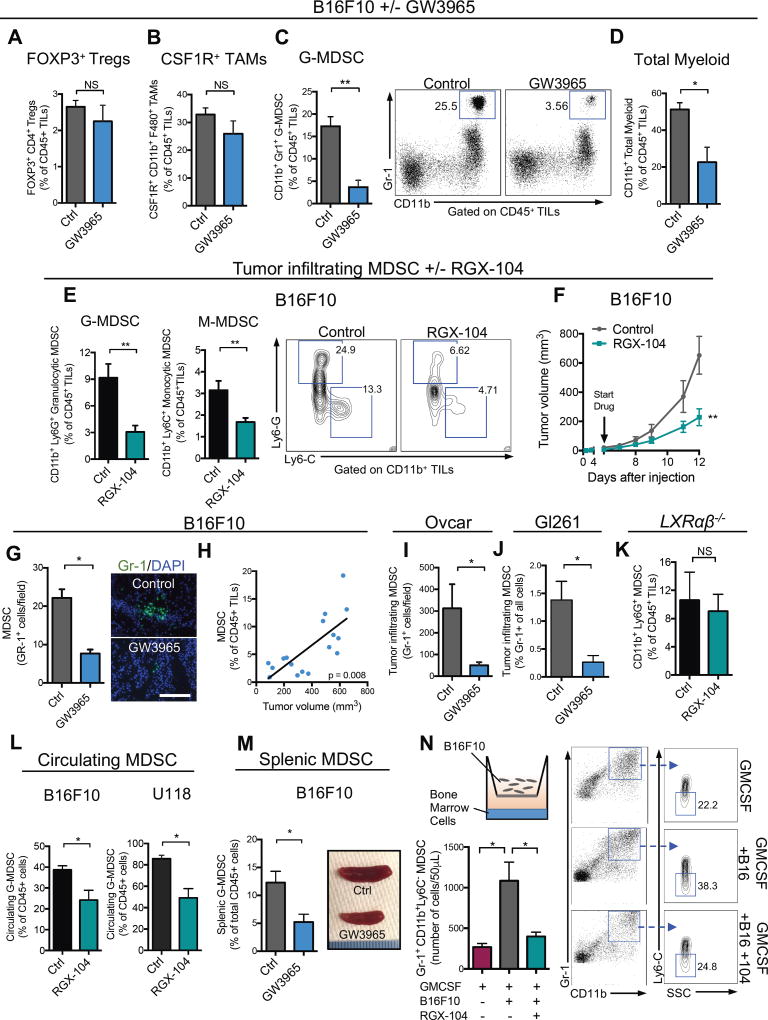
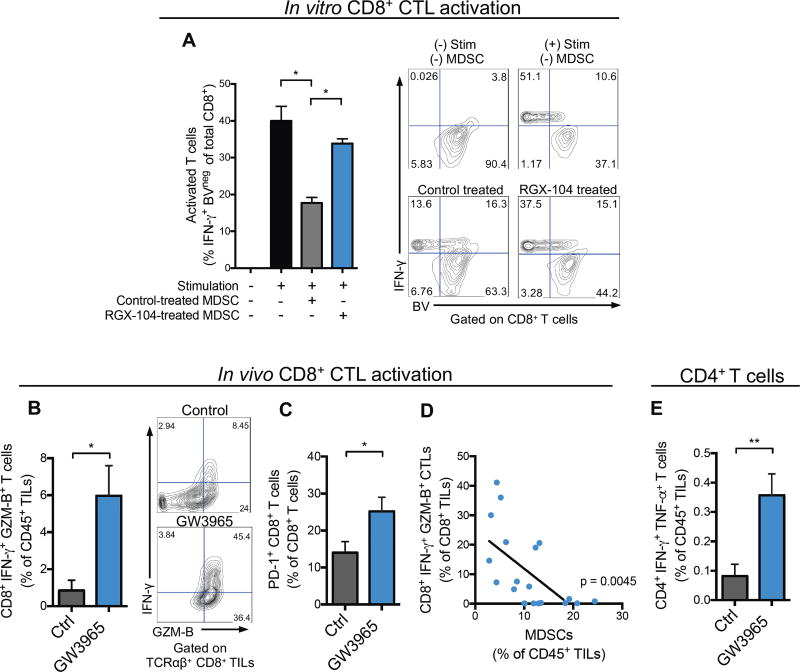
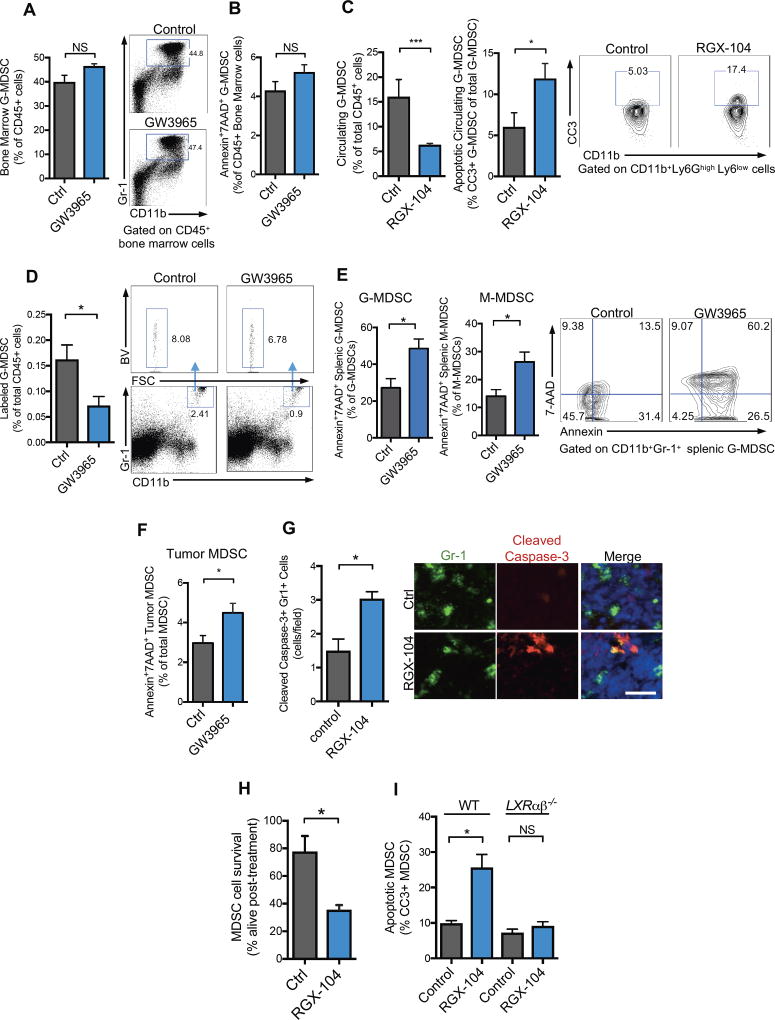
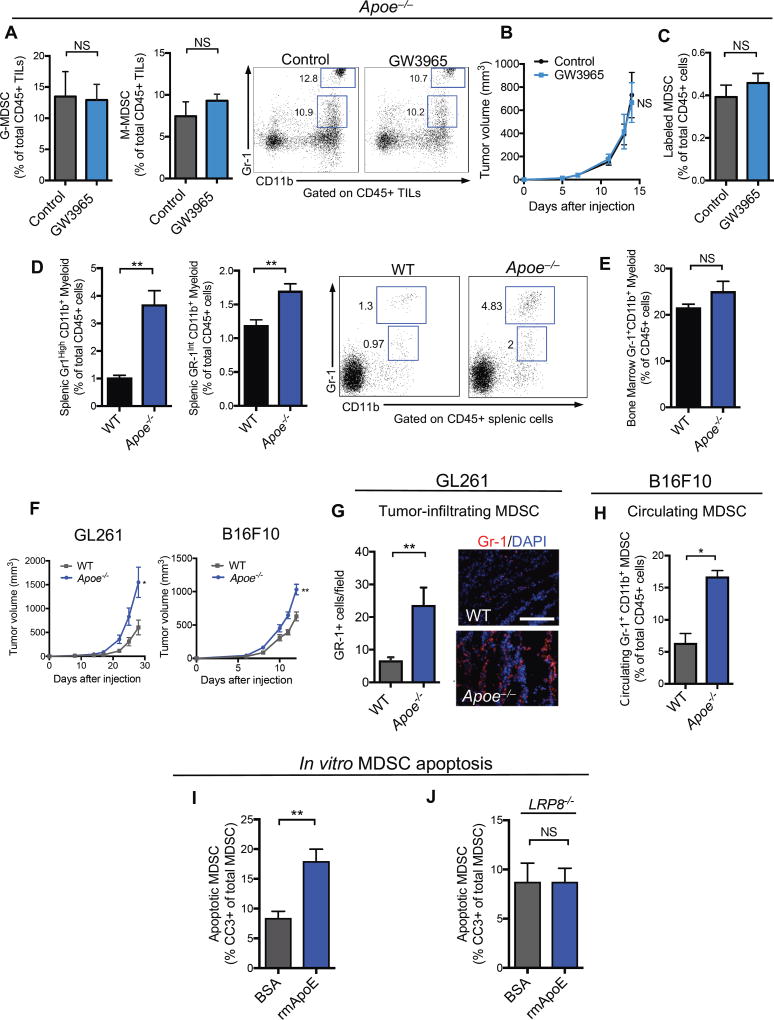
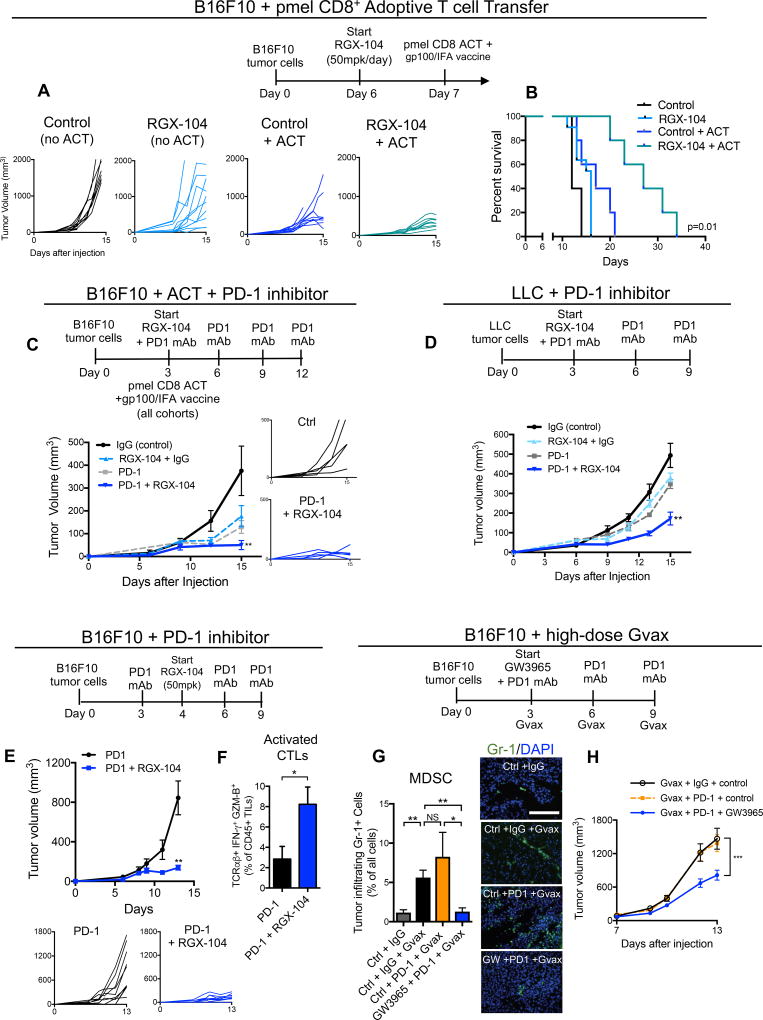
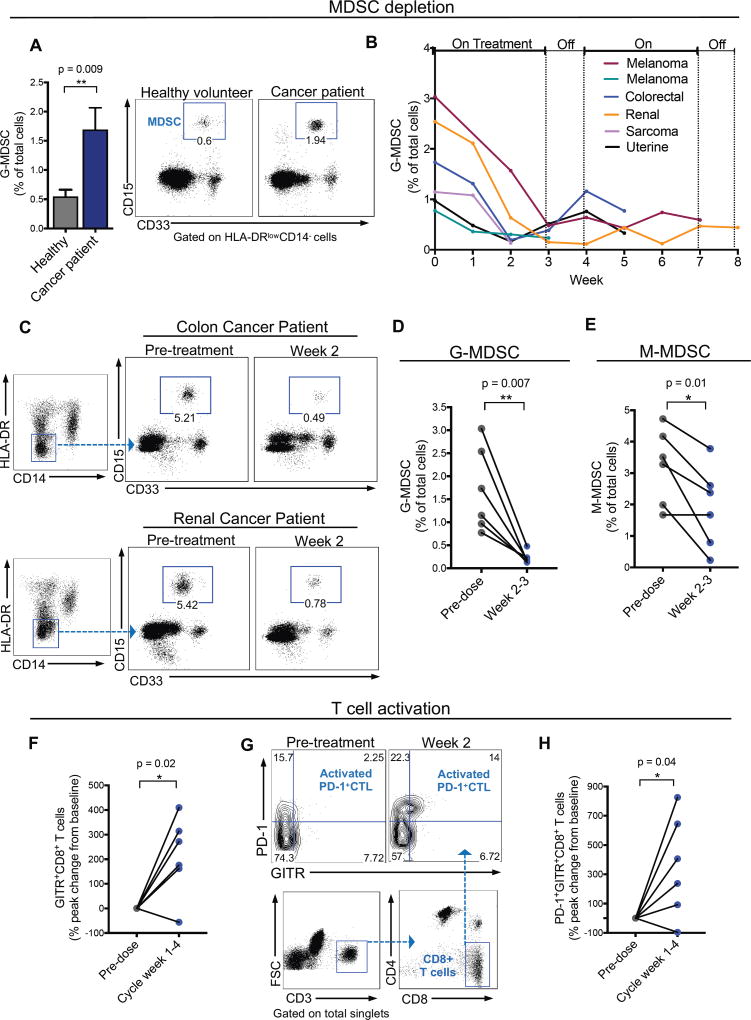
Therapeutic harnessing of adaptive immunity via checkpoint inhibition has transformed the treatment of many cancers. Despite unprecedented long-term responses, most patients do not respond to these therapies. Immunotherapy non-responders often harbor high levels of circulating myeloid-derived suppressor cells (MDSCs)-an immunosuppressive innate cell population. Through genetic and pharmacological approaches, we uncovered a pathway governing MDSC abundance in multiple cancer types. Therapeutic liver-X nuclear receptor (LXR) agonism reduced MDSC abundance in murine models and in patients treated in a first-in-human dose escalation phase 1 trial. MDSC depletion was associated with activation of cytotoxic T lymphocyte (CTL) responses in mice and patients. The LXR transcriptional target ApoE mediated these effects in mice, where LXR/ApoE activation therapy elicited robust anti-tumor responses and also enhanced T cell activation during various immune-based therapies. We implicate the LXR/ApoE axis in the regulation of innate immune suppression and as a target for enhancing the efficacy of cancer immunotherapy in patients.

Keywords: ApoE; LRP8; LXR; MDSC; cancer; clinical trial; immune therapy; myeloid; nuclear hormone receptor; tumor immunology.


Figures

Figure 1
Figure 1. LXR agonist treatment robustly suppresses tumor growth and progression across a broad set of mouse and human tumors
(A–C) Tumor growth by 1 × 10⁶ SKOV3 ovarian cancer cells subcutaneously injected into NOD SCID (A) or RAG (C) mice. Following tumor growth to 5–10 mm3 (A) or 40–50 mm3 (C) in volume, mice were fed control chow or chow supplemented with GW3965 (100 mg/kg/day) (A) or RGX-104 (100 mg/kg/day) (C); insets represent growth curves for individual tumors. (B) Survival of mice bearing SKOV3 tumors shown in (A) (n ≥ 5). (D–F) Tumor growth by 1 × 10⁶ U118 glioblastoma cells subcutaneously injected into NOD SCID mice. Following tumor growth to 5–10 mm3(D) or 200–250 mm3 (F) in volume, mice were fed a control chow or a chow supplemented with GW3965 (100 mg/kg) (D) or RGX-104 (100 mg/kg) (F). (E) Survival of mice bearing U118 tumors shown in (D) (n ≥ 5). (G) Tumor growth by 2.5 × 10⁵ GL261 glioblastoma cells subcutaneously injected into C57BL/6 mice. Following tumor growth to 5–10 mm3 in volume, mice were fed control chow or chow supplemented with GW3965 (100 mg/kg) (n ≥ 5). (H–I) Tumor growth (H) and metastasis (I) by 2 × 10⁵ LLC lung cancer cells subcutaneously injected into C57BL/6 mice. Following tumor growth to 5–10 mm3 (H) or 30–40 mm3 in volume (I), mice were fed control chow or chow supplemented with GW3965 (100 mg/kg) (H) or RGX-104 (100 mg/kg) (I). (I) Quantification of macroscopic metastatic nodules in H&E-stained lungs extracted at day 15 (n ≥ 5). (J) Tumor growth and bioluminescence quantification of lung metastasis of 1 × 10⁶ MDA468 breast cancer cells subcutaneously injected into NOD SCID mice. Following tumor growth to 5–10 mm3 in volume, mice were fed control chow or chow supplemented with GW3965 (100 mg/kg) (n ≥ 4). (K) Quantification and exemplary images of macroscopic metastatic nodules in H&E-stained lungs extracted 71 days after subcutaneous injection of 1 × 10⁶ ACHN renal cancer cells; mice were fed control chow or chow supplemented with GW3965 (100 mg/kg) when tumors reached 5–10 mm3 (n ≥ 4). (L) Tumor growth by 5 × 10⁴ Renca renal cancer cells subcutaneously injected into syngeneic C57BL/6 mice. Following tumor growth to 5–10 mm3 in volume, mice were fed a control chow or a chow supplemented with GW3965 (100 mg/kg). Survival of mice bearing Renca tumors is shown (n ≥ 5). (M) Tumor growth by 5 × 10⁴ B16F10 cells subcutaneously injected into C57BL/6 mice. Following tumor growth to 5–10 mm3 in volume, mice were fed control chow or chow supplemented with GW3965 (100 mg/kg) (n ≥ 5). (N) Tumor growth by 5 × 10⁵ MC38 colon cancer cells subcutaneously injected into C57BL/6 mice. Following tumor growth to 5–10 mm3 in volume, mice were fed a control chow or a chow supplemented with RGX-104 (100 mg/kg) (n ≥ 6). (O) Tumor volume at day 16 by 5 × 105 MC38 cells injected subcutaneously into C57BL/6 or NSG mice. Following tumor growth to 5–10 mm3 in volume, mice were fed a control chow or a chow supplemented with RGX-104 (100 mg/kg) (n ≥ 6). Data represent mean ± s.e.m. See also Figure S1.
Figure 2
Figure 2. LXR agonism reduces tumor-infiltrating and systemic myeloid-derived suppressor cells
Percent tumor-infiltrating immune cells of total CD45+ tumor-infiltrating lymphocytes (TILs), A–D, in B16F10 tumors in mice treated with control or GW3965 (100 mg/kg) administered in chow when tumors reached 5–10 mm3 in volume. Flow cytometry analysis was performed 14 days after tumor injection (n = 6). (A) Foxp3+ T regulatory cells, (B) CSF-1R+ tumor-associated macrophages, (C) total granulocytic myeloid-derived suppressor cells, and (D) total myeloid lineage cells. Representative plots show CD11b+ Gr-1high granulocytic MDSC populations. (E) Percent granulocytic (left) and monocytic (right) MDSCs of CD45+ TILs in B16F10 tumors grown in mice treated with control or RGX-104 (80 mg/kg) administered I.P when tumors reached 5–10 mm3. Flow cytometry analysis was performed 13 days after tumor injection (n ≥ 8). Representative contour plots show Ly6G+ granulocytic and Ly6C+ monocytic populations. (F) Mean tumor volume of subcutaneous B16F10 tumors described in (E) (n ≥ 5). (G) Quantification of tumor-infiltrating Gr-1+ cells in B16F10 tumors removed at day 11 on treatment with control or GW3965 (100 mg/kg). Representative images of Gr-1+ immunofluorescence in B16F10 tumor sections on treatment with control (top) or GW3965 (bottom). Five sections were imaged per tumor to achieve an average number of tumor-infiltrating Gr-1+ cells per high-power field (n = 6). Scale bar =143 microns. (H) Correlation between percent tumor-infiltrating G-MDSCs and tumor volume (n = 17). (I–J) Quantification of tumor-infiltrating Gr-1+ cells in Ovcar (I) and GL261 (J) tumors removed at day 81 (I) and 27 (J) on treatment with control or GW3965 (100 mg/kg). Five sections were imaged per tumor to achieve an average number of tumor-infiltrating Gr-1+ cells (n = 5). (K) Percent granulocytic MDSCs of total CD45+ TILs in B16F10 tumors grown in LXRαβ−/− mice treated with control or RGX-104 (100 mg/kg) when tumors reached 5–10 mm3 (n ≥ 6). (L) Percent circulating granulocytic MDSCs of total CD45+ lymphocytes in peripheral blood of B16F10 (left) or U118 (right) tumor-bearing mice treated with control or RGX-104 (100 mg/kg) (n = 5). (M) Percent granulocytic MDSCs of total CD45+ splenocytes (n = 5). Representative spleens of control or GW3965-treated mice after 10 days of treatment (right). (N) Transwell MDSC differentiation assay. Bone marrow cells were cultured with B16F10 melanoma cells and GMCSF for 6 days. On day 3, RGX-104 (2uM) was added to the culture. Mean number of Gr-1high CD11b+ cells per 50uL of the culture solution is shown as assessed by flow cytometry on day 6. Data represent mean ± s.e.m. See also Figure S2.
Figure 3
Figure 3. LXR agonism increases tumor-infiltrating activated CD8+ and CD4+ T cells
(A) Suppressive properties of splenic MDSCs isolated from tumor bearing mice treated in vivo with control or RGX-104 (100 mg/kg) chow for 48 hours—as assessed by CD8+ T cell activation (IFN-γ expression) and proliferation (BV dilution) after co-culture in vitro. Representative contour plots show IFN-γ expression and BV fluorescence of CD8+ cells (n = 4). (B) Percent IFN-γ and Granzyme B (GZM-B) expressing, activated CD8+ T cells of total CD45+ TILs from B16F10 tumors of control or GW3965-treated mice (100 mg/kg) after 10 days of treatment (n = 6). Representative contour plots show percentages of double positive cells. (C) Percent PD-1+ CD8+ T cells of total tumor-infiltrating CD8+ T cells from B16F10 tumors of control or GW3965-treated mice (100 mg/kg; 10 days) (n = 6). (D) Correlation between tumor-infiltrating CD8+IFN-γ+GZM-B+ T cells and G-MDSCs, reported as percentages of total CD8+ and CD45+ TILs, respectively (n = 20). (E) Percent CD4+IFN-γ+TNFα+ T cells of total CD45+ TILs from B16F10 tumors treated for 10 days with control or GW3965 (100 mg/kg) (n = 6). Data represent mean ± s.e.m. See also Figure S3.
Figure 4
Figure 4. LXR agonist treatment promotes MDSC apoptosis in vivo and in vitro
(A) Percent Gr1+ CD11b+ G-MDSCs of total CD45+ lymphocytes in bone marrow of GW3965-treated (100 mg/kg) mice as compared to controls after 10 days of treatment (n = 5). (B) Percent Annexin+ 7AAD+ G-MDSCs of total CD45+ bone marrow cells after GW3965 treatment (100mg/kg) for 10 days as compared to controls (n = 5). (C) Percent circulating G-MDSCs of total CD45+ lymphocytes in RGX-104-treated (100 mg/kg) mice as compared to controls after 8 days of treatment (left) and percentage of cleaved caspase-3+ (CC3+) GMDSCs of total circulating G-MDSCs from B16F10 tumor bearing mice treated for 8 days with either control or RGX-104 (100m/kg) (right) (n = 8). Contour plots show population of cleaved caspase-3+ MDSCs. (D) Percentage of labeled, adoptively transferred G-MDSCs of total CD45+ splenocytes from recipient mice treated for 48 hours with GW3965 or control after adoptive transfer. Representative plots show labeled CD11b+Gr-1+ MDSCs from control and GW3965 treated recipient mice (n = 5). (E) Annexin+ 7AAD+ granulocytic (left) and monocytic (right) CD11b+Gr-1+ MDSCs of total CD45+ splenic lymphocytes. Representative contour plots show double positive cells gated on CD11b+ Gr1high G-MDSCs (n = 5). (F) Percent Annexin+ 7AAD+ G-MDSCs of total CD11b+ Gr1+ G-MDSCs in B16F10 tumors (n = 5). (G) Quantification of caspase-3+ Gr-1+ cells in the spleens of B16F10 tumor-bearing mice after 12 days of control or RGX-104 (100 mg/kg) treatment. 5 sections per spleen were imaged to calculate an average number of double positive cells per high-power field (n=5). Representative immunofluorescence images of splenic sections stained for Gr-1 and cleaved caspase-3 treated with control (top) or RGX-104 (100 mg/kg) (bottom). Scale bar =29 microns. (H) Percent CD11b+Gr-1+ MDSCs alive after 3 hours of treatment in vitro with RGX-104 (2uM). MDSCs were isolated from B16F10 tumor-bearing mice (n = 4). (I) Percent cleaved caspase-3+ Gr1+ CD11b+ MDSCs from wild type (WT) or LXRαβ−/− B16F10-tumor bearing mice treated in vitro with 1uM RGX-104 or vehicle control after a 6-hour culture (n = 4). Data represent mean ± s.e.m. See also Figure S4.
Figure 5
Figure 5. ApoE/LRP8 signaling regulates MDSC survival downstream of LXR agonism
(A) Percent tumor-infiltrating granulocytic (left) and monocytic (right) MDSCs of total CD45+ tumor-infiltrating lymphocytes in B16F10 tumors in Apoe−/− mice treated with control or GW3965 (100 mg/kg) (n ≥ 4). Representative plots show CD11b+Gr1high granulocytic and CD11b+Gr1int monocytic populations. (B) Mean tumor growth of control- or GW3956-treated ApoE-depleted B16F10 tumors injected into Apoe−/− mice (n = 4). (C) Percentage of labeled, adoptively transferred ApoE deficient (Apoe−/−) MDSCs of total CD45+ splenocytes from ApoE−/− recipient mice treated for 48 hours with GW3965 or control after adoptive transfer (n = 5). (D) Percent splenic granulocytic (left) and monocytic (right) CD11b+Gr-1+ myeloid cells of total CD45+ splenic lymphocytes in WT and Apoe−/− mice (n = 5). (E) Percent CD11b+Gr-1+ myeloid cells of total CD45+ lymphocytes in the bone marrow of WT and Apoe−/− mice (n = 5). (F) Mean tumor growth of GL261 (left) and B16F10 (right) grown in WT and Apoe−/− mice (n = 5). (G) Quantification (left) and representative immunofluorescence staining (right) of tumor-infiltrating Gr-1+ cells in GL261 tumors grown in WT and Apoe−/− mice for 27 days (n = 6). 5 sections per tumor were imaged to calculate an average number of Gr-1+ cells per high-power field (n = 5). Scale bar =143 microns. (H) Percent circulating Gr-1+ CD11b+ G-MDSCs of total CD45+ cells after 7 days of tumor growth in WT or Apoe−/− mice (n = 5). (I) Percent cleaved caspase-3+ (CC3+) Gr1+ CD11b+ splenic MDSCs from WT B16F10-tumor bearing mice treated in vitro with 5uM BSA or recombinant mouse ApoE protein (rmApoE) after a 6-hour culture (n = 4). (J) Percent cleaved caspase-3+ (CC3+) Gr1+ CD11b+ splenic MDSCs from LRP8−/− B16F10-tumor bearing mice treated in vitro with 5uM BSA or recombinant mouse ApoE protein (rmApoE) after a 6-hour culture (n = 4). Data represent mean ± s.e.m. See also Figure S5.
Figure 6
Figure 6. LXR agonism provides additive anti-tumor efficacy when combined with immunotherapy
(A) Therapy regimen schematic (top) and individual tumor volumes of subcutaneous B16F10 tumors. Treatment cohorts include control without adoptive T cell transfer (ACT), RGX-104 (50mg/kg) without ACT, control with ACT and gp100 vaccination, and RGX-104 (50 mg/kg) with ACT and gp100 vaccination. 2 × 10⁶ CD8+ T cells from Pmel mice were transferred per recipient (n ≥ 5). (B) Survival data at 34 days of B16F10 tumor-bearing mice treated with ACT and gp100 vaccination, RGX-104 (50mg/kg), or ACT and gp100 vaccination in combination with RGX-104 (50 mg/kg) as compared to control (n ≥ 5). (C) Therapy regimen schematic (top), mean tumor volume (left), and individual tumor growth curves (right) of subcutaneous B16F10 tumors. Treatment cohorts include RGX-104 (100 mg/kg) with control antibody isotype-matched to anti-PD-1, anti-PD-1, and anti-PD-1 with RGX-104 (100 mg/kg) as compared to control (control antibody isotype-matched to anti-PD-1). All cohorts received ACT of 2×10⁶ CD8+ T cells from Pmel mice per recipient, as well as gp100 vaccination 3 days after tumor injections (n = 7). (D) Therapy regimen (top) and mean tumor volume of subcutaneous Lewis Lung Carcinoma (LLC) tumors. Treatment cohorts include RGX-104 (100 mg/kg) with control antibody isotype-matched to anti-PD-1, anti-PD-1, and anti-PD-1 with RGX-104 (100 mg/kg) as compared to control (control antibody isotype-matched to anti-PD-1) (n = 7). (E) Therapy regimen schematic (top), mean tumor volume (left) and individual tumor growth curves (below) of subcutaneous B16F10 tumors treated with anti-PD-1 monoclonal antibody or anti-PD-1 with RGX-104 (50 mg/kg) (n = 5). (F) Percent TCRαβ+IFN-γ+GZM-B+ expressing, cytotoxic T cells of total CD45+ TILs from B16F10 tumors treated with anti-PD-1 or anti-PD-1 in combination with RGX-104 (50 mg/kg) as described in (E) (n = 5) (G) Therapy regimen (top) and quantification (left) and representative immunofluorescence images of tumor-infiltrating Gr-1+ cells within subcutaneous B16F10 tumors. Treatment cohorts included Gvax with control antibody isotype-matched to anti-PD-1, Gvax with anti-PD-1, Gvax with anti-PD-1 and GW3965 (100 mg/kg) as compared to control (with control antibody isotype-matched to anti-PD-1) (n = 6). Scale bar =143 microns. (H) Mean tumor volumes of B16F10 subcutaneous tumors from the cohorts described in (G). Cohorts included Gvax with control antibody isotype-matched to anti-PD-1, Gvax with anti-PD-1, and Gvax with anti-PD-1 and GW3965 (100mg/kg) (n = 6). Data represent mean ± s.e.m.
Figure 7
Figure 7. RGX-104 depletes MDSCs and activates CD8+ T cells in human cancer patients
(A) Percent of granulocytic MDSCs (G-MDSC) of total circulating cells in the peripheral blood of cancer patients relative to healthy volunteers (n ≥ 6). Representative plots demonstrating the G-MDSC population in healthy volunteers compared to cancer patients. (B) Percent of G-MDSCs of total circulating cells measured weekly from six patients treated with two 28-day cycles of RGX-104 (administered once daily for three weeks, then off for one week) – week 0 corresponds immediately prior to treatment initiation. For some patients, data is not available for the entire two cycles due to lack of blood samples or treatment termination (n = 6). (C) Representative plots demonstrating the G-MDSC population in a colorectal cancer patient (top) and a renal cancer patient (bottom) treated with RGX-104 at week 0 (pre-treatment) compared with 2 weeks after therapy initiation. (D–E) Percent G-MDSCs (D) and M-MDSC (E) of total circulating cells in 6 patients treated with RGX-104 at week 0 compared to weeks 2–3 on therapy (n = 6). (F) Percent peak change in CD8+ T cells that express GITR of total CD8+ T cells in the circulation of patients treated with RGX-104 at week 0 compared to weeks 1–4 of the therapy cycle (n = 6). (G) Representative plot showing the population of PD-1+GITR+ double-positive CD8+ T cells (activated PD-1+ CTLs) in the circulation of a patient treated with RGX-104 at week 0 (pre-treatment) and at week 2 of therapy. (H) Percent peak change in CD8+ T cells that are double positive for PD-1+GITR+ in the circulation of patients treated with RGX-104 at week 0 compared to weeks 1–4 of the therapy cycle (n = 6). Data represent mean ± s.e.m. See also Figure S6.

Comment in

References

    1. Almand B, Clark JI, Nikitina E, van Beynen J, English NR, Knight SC, Carbone DP, Gabrilovich DI. Increased production of immature myeloid cells in cancer patients: a mechanism of immunosuppression in cancer. J Immunol. 2001;166:678–689. - PubMed
    1. Andersen V, Christensen J, Ernst A, Jacobsen BA, Tjonneland A, Krarup HB, Vogel U. Polymorphisms in NF-kappaB, PXR, LXR, PPARgamma and risk of inflammatory bowel disease. World J Gastroenterol. 2011;17:197–206. - PMC - PubMed
    1. Apfel R, Benbrook D, Lernhardt E, Ortiz MA, Salbert G, Pfahl M. A novel orphan receptor specific for a subset of thyroid hormone-responsive elements and its interaction with the retinoid/thyroid hormone receptor subfamily. Mol Cell Biol. 1994;14:7025–7035. - PMC - PubMed
    1. Bensinger SJ, Bradley MN, Joseph SB, Zelcer N, Janssen EM, Hausner MA, Shih R, Parks JS, Edwards PA, Jamieson BD, et al. LXR signaling couples sterol metabolism to proliferation in the acquired immune response. Cell. 2008;134:97–111. - PMC - PubMed
    1. Curran MA, Allison JP. Tumor vaccines expressing flt3 ligand synergize with ctla-4 blockade to reject preimplanted tumors. Cancer Res. 2009;69:7747–7755. - PMC - PubMed

Publication types

MeSH terms