. 2018 Feb 13;10(2):553-567.
doi: 10.1016/j.stemcr.2017.12.009. Epub 2018 Jan 11.

Purification of GFRα1+ and GFRα1- Spermatogonial Stem Cells Reveals a Niche-Dependent Mechanism for Fate Determination

Affiliations

Purification of GFRα1+ and GFRα1- Spermatogonial Stem Cells Reveals a Niche-Dependent Mechanism for Fate Determination

Alina Garbuzov et al. Stem Cell Reports. .

Abstract

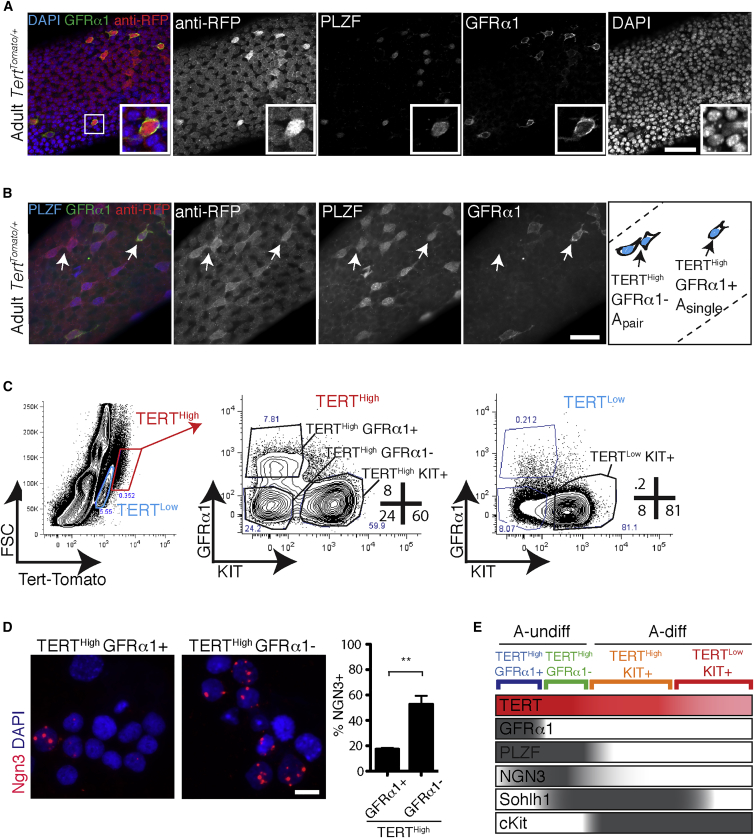
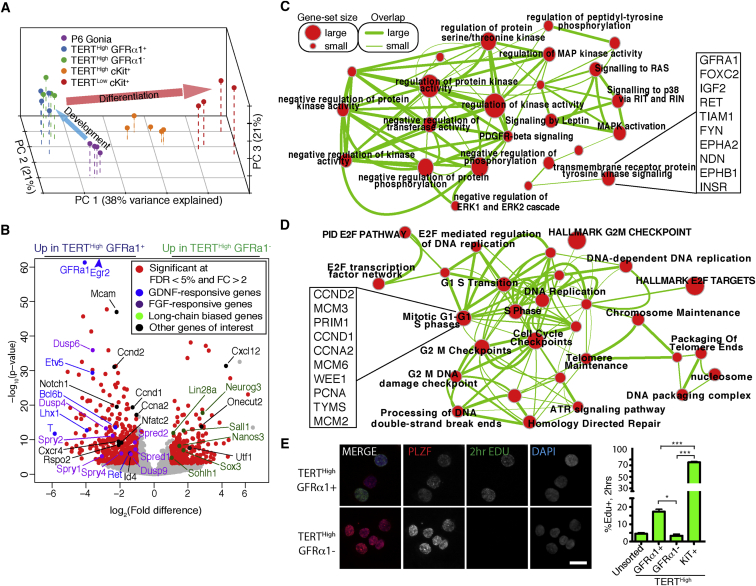
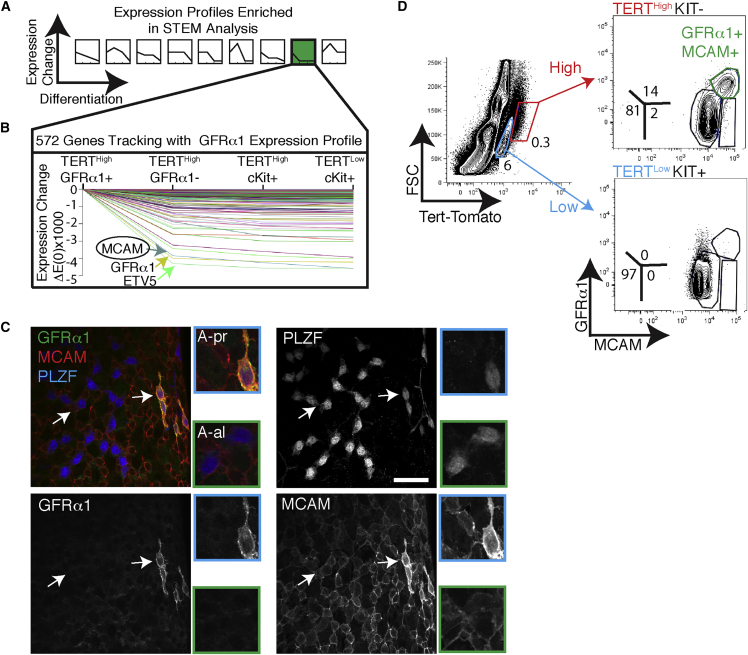
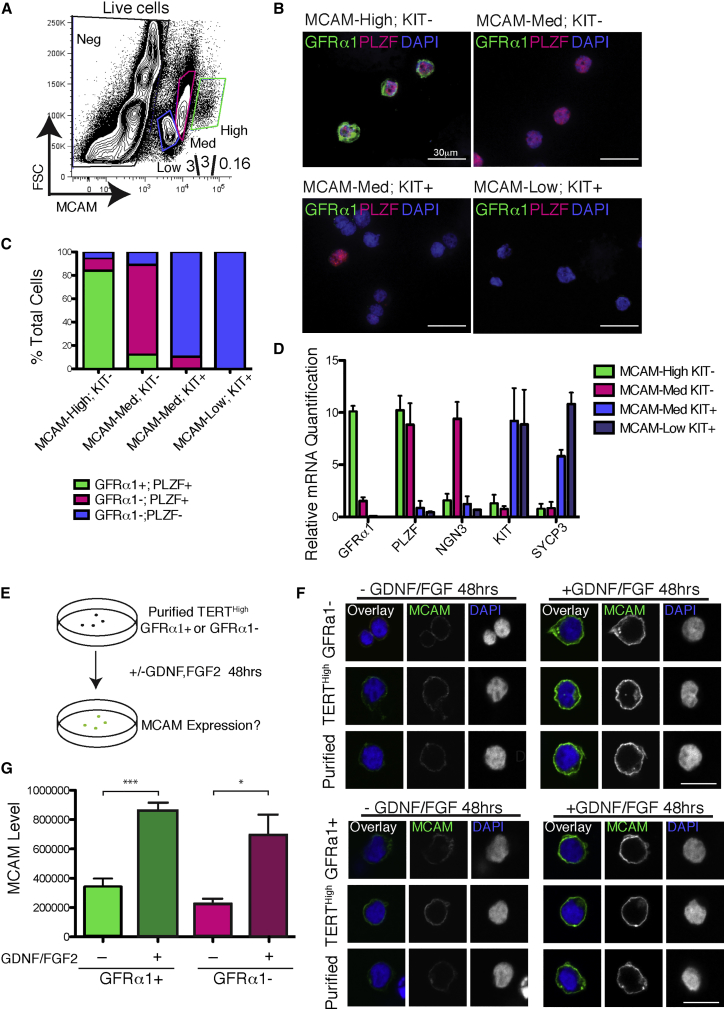
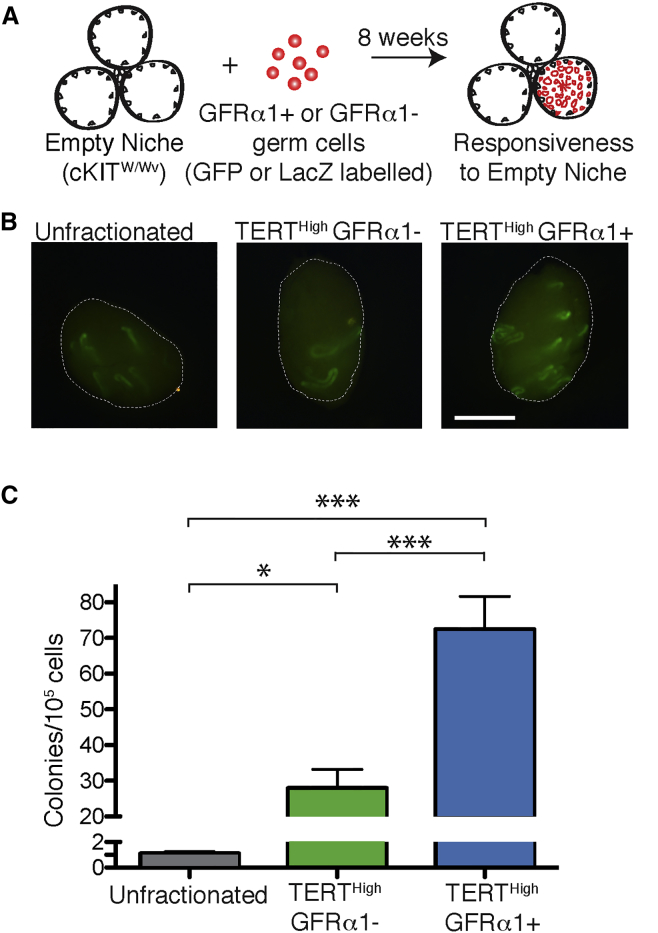
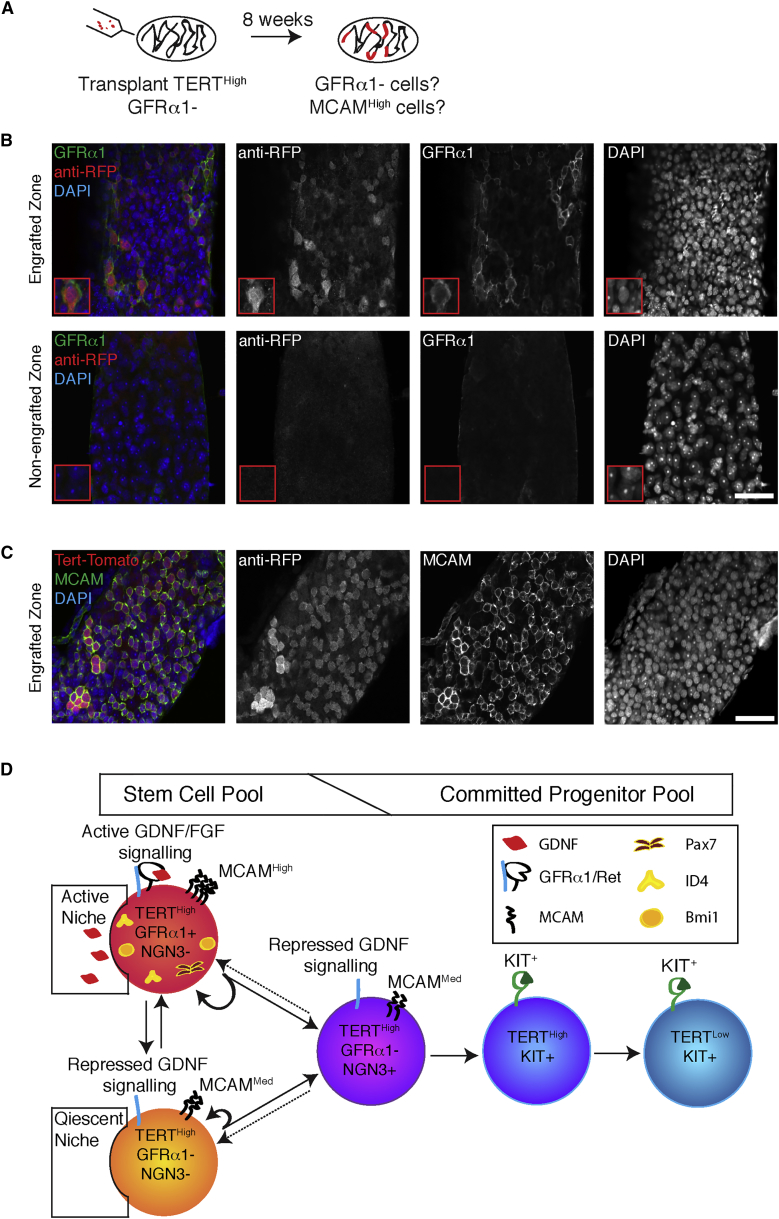
Undifferentiated spermatogonia comprise a pool of stem cells and progenitor cells that show heterogeneous expression of markers, including the cell surface receptor GFRα1. Technical challenges in isolation of GFRα1+ versus GFRα1- undifferentiated spermatogonia have precluded the comparative molecular characterization of these subpopulations and their functional evaluation as stem cells. Here, we develop a method to purify these subpopulations by fluorescence-activated cell sorting and show that GFRα1+ and GFRα1- undifferentiated spermatogonia both demonstrate elevated transplantation activity, while differing principally in receptor tyrosine kinase signaling and cell cycle. We identify the cell surface molecule melanocyte cell adhesion molecule (MCAM) as differentially expressed in these populations and show that antibodies to MCAM allow isolation of highly enriched populations of GFRα1+ and GFRα1- spermatogonia from adult, wild-type mice. In germ cell culture, GFRα1- cells upregulate MCAM expression in response to glial cell line-derived neurotrophic factor (GDNF)/fibroblast growth factor (FGF) stimulation. In transplanted hosts, GFRα1- spermatogonia yield GFRα1+ spermatogonia and restore spermatogenesis, albeit at lower rates than their GFRα1+ counterparts. Together, these data provide support for a model of a stem cell pool in which the GFRα1+ and GFRα1- cells are closely related but show key cell-intrinsic differences and can interconvert between the two states based, in part, on access to niche factors.

Keywords: FACS; RNA-seq; germ cells; germ line; niche; spermatogonial stem cells; stem cells; telomerase; transplantation.


Figures

Figure 1
Figure 1
High Telomerase Expression Enables the Purification and Characterization of GFRα1+ and GFRα1– Undifferentiated Spermatogonia (A) Whole-mount analysis of adult seminiferous tubules immunostained for GFRα1, PLZF, and anti-RFP in TertTomato/+ seminiferous tubules. A total of 99.3% ± 0.5% of GFRα1+ PLZF+ cells were Tert-Tomato+ (N = 370 cells; N = 4 mice); 99.8% ± 0.1% GFRα1– PLZF+ cells were Tert-Tomato+ (N = 1900 cells; N = 6 mice). Scale bar, 50 μm. (B) Whole-mount analysis of adult seminiferous tubules immunostained for GFRα1, PLZF, and anti-RFP in TertTomato/+ seminiferous tubules. White arrows point to TERTHigh GFRα1− A-paired (left arrow) and TERTHigh GFRα1− A-single (right arrow) spermatogonia. Scale bar, 50 μm. (C) Flow cytometry measurement of GFRα1 and KIT expression in TERTHigh cells. Panels are representative of at least six independent FACS runs. (D) In situ hybridization for NGN3 mRNA on FACS-sorted cells of the indicated immunophenotypes. Percentage of NGN3+ cells was quantified. Mean and SEM are shown. Scale bar, 25 μm. N = 5–6 mice; at least 2,000 cells counted per condition. ∗∗p = 0.012. (E) Interpretation of identities of various sorted cell types, based on whole-mount, cytospin, immunophenotype, and neonatal time course data.
Figure 2
Figure 2
RNA-Seq Reveals That GFRα1+ Spermatogonia Are Defined by a Transcriptional Signature of Active GDNF and FGF Signaling (A) Principal-component analysis (PCA) of transcriptomes from five isolated spermatogonial populations from adult and postnatal day 6 (P6) juvenile. (B) Volcano plot of expression profiles comparing TERTHigh GFRα1+ KIT– to TERTHigh GFRα1– KIT– cells. (C) MAP/ERK/protein phosphorylation cluster generated by Cytoscape Enrichment Map of gene set enrichment analysis (GSEA) results for TERTHigh GFRα1+. (D) Cell-cycle/proliferation cluster generated by Cytoscape Enrichment Map of GSEA results for TERTHigh GFRα1+. (E) Indicated cell types were sorted and cytospun. A 2 hr EdU pulse was visualized using Click chemistry, and the cells were then immunostained for the undifferentiated spermatogonia marker PLZF. Scale bar, 25 μm. Percentage of EdU+ cells was quantified. Mean and SEM are shown. (N = 5 mice; N = 900–10,000 cells per condition). p < 0.05; ∗∗∗p < 0.001.
Figure 3
Figure 3
MCAM Is a Cell Surface Marker of the GFRα1+ State (A) Nine patterns of gene expression changes across adult spermatogonial populations identified as statistically significant by Short Time-series Expression Miner (STEM). (B) Details on STEM pattern no. 8, containing genes with peak expression in TERTHigh GFRα1+ cells, with diminished expression in all other cell types. Genes of interest are highlighted. The entire list of 575 genes is found in Table S2. (C) Whole-mount analysis of tubules triple-stained for MCAM, GFRα1, and PLZF. All 76/76 GFRα1+ cells were MCAMHigh. White arrows point to cells shown in greater magnification in the panels to the right. Scale bar, 50 μm. N = 3 mice. (D) Flow cytometry measurement of GFRα1 and MCAM expression in TERTHigh KIT– cells and TERTLow KIT+. Panels are representative of at least six independent FACS runs.
Figure 4
Figure 4
MCAM Levels Can be Used to Isolate Both GFRα1+ and GFRα1– Undifferentiated Spermatogonia and Are Responsive to GDNF/FGF (A) Flow cytometry measurement of MCAM levels in whole adult testis from wild-type mice. (B) Indicated populations were sorted from wild-type mice, cytopun, and stained for GFRα1, PLZF, and DAPI. (C) Quantification of (B) showing fraction of GFRα1+ PLZF+, GFRα1– PLZF+, and GFRα1– PLZF– cells in each MCAM population. N = 3 mice pooled; N = 1,524 cells. (D) qRT-PCR for indicated SSC and differentiation markers from cells sorted based on MCAM expression and KIT. Mean and SEM are shown. (E) Experimental outline of cell culture experiments. Indicated cells populations were sorted and cultured in basal GS medium supplemented with or without 50 ng/mL GDNF and 20 ng/mL FGF2. Forty-eight hours later, anti-MCAM immunofluorescence was performed. (F) Effect of GDNF/FGF on MCAM expression. TERTHigh GFRα1+ cells and TERTHigh GFRα1– cells were stained for MCAM and DAPI after 48 hr of culture. Scale bar, 15 μm. (G) Quantification of (E). (N = 4 mice; N = 50 cells). Mean and SEM are shown. p < 0.05; ∗∗∗p < 0.001.
Figure 5
Figure 5
Elevated Stem Cell Repopulating Activity in GFRα1+ and GFRα1– Undifferentiated Spermatogonia (A) Experimental outline of transplant experiments. Tert-Tomato cells permanently labeled by ubiquitous GFP or LacZ expression were transplanted into sterile KitW/Wv recipients. Colonies were counted 2 months post-injection. (B) Representative EGFP epifluorescence in recipient KitW/Wv mice 8 weeks after transplantation of cells shown in (A). White lines represent boundary of the testis. “Unfractionated” represents the transplantation of FACS-sorted live cells not fractionated by Tert-Tomato expression or immunophenotype. Scale bar, 2 μm. (C) Quantification of transplant results shown in (B). Colony counts were normalized to 105 cells. Mean and SEM are shown. p Values are from two-tailed Mann-Whitney test. N = 16–18 recipient testes per condition. p = 0.019 ∗∗∗p < 0.0005.
Figure 6
Figure 6
In Vivo Conversion of GFRα1– Undifferentiated Spermatogonia to GFRα1+ Undifferentiated Spermatogonia (A) Experimental outline of transplant experiments. GFRα1– Tert-Tomato cells permanently labeled by ubiquitous GFP or LacZ expression were transplanted into sterile KitW/Wv recipients. Tubules were stained for MCAM and GFRα1 2 months post transplant. (B) GFRα1 expression in colonies arising from transplanted TERTHigh GFRα1– cells. Tert-Tomato used as a marker for the donor cells. Staining results are compared with regions of testis that were not colonized. Scale bar, 50 μm. (C) MCAM expression in colonies arising from transplanted TERTHigh GFRα1– cells. Tert-Tomato used as a marker for the donor cells. Scale bar, 50 μm. (D) Model for a flexible hierarchy of adult spermatogonia. Cell surface features of different spermatogonial subtypes are highlighted. GFRα1– spermatogonia represent a poised state, competent to either differentiate or convert to GFRα1+ spermatogonia in a context-dependent fashion.

References

    1. Aloisio G.M., Nakada Y., Saatcioglu H.D., Pena C.G., Baker M.D., Tarnawa E.D., Mukherjee J., Manjunath H., Bugde A., Sengupta A.L. PAX7 expression defines germline stem cells in the adult testis. J. Clin. Invest. 2014;124:3929–3944. - PMC - PubMed
    1. Beumer T.L., Roepers-Gajadien H.L., Gademan I.S., Kal H.B., de Rooij D.G. Involvement of the D-type cyclins in germ cell proliferation and differentiation in the mouse. Biol. Reprod. 2000;63:1893–1898. - PubMed
    1. Branney P.A., Faas L., Steane S.E., Pownall M.E., Isaacs H.V. Characterisation of the fibroblast growth factor dependent transcriptome in early development. PLoS One. 2009;4:e4951. - PMC - PubMed
    1. Brinster R.L., Zimmermann J.W. Spermatogenesis following male germ-cell transplantation. Proc. Natl. Acad. Sci. USA. 1994;91:11298–11302. - PMC - PubMed
    1. Buageaw A., Sukhwani M., Ben-Yehudah A., Ehmcke J., Rawe V.Y., Pholpramool C., Orwig K.E., Schlatt S. GDNF family receptor alpha1 phenotype of spermatogonial stem cells in immature mouse testes1. Biol. Reprod. 2005;73:1011–1016. - PubMed

Publication types

MeSH terms

Substances