. 2018 Feb 1;128(2):580-588.
doi: 10.1172/JCI96061. Epub 2018 Jan 16.

PD-L1 on host cells is essential for PD-L1 blockade-mediated tumor regression

Affiliations

PD-L1 on host cells is essential for PD-L1 blockade-mediated tumor regression

Haidong Tang et al. J Clin Invest. .

Abstract

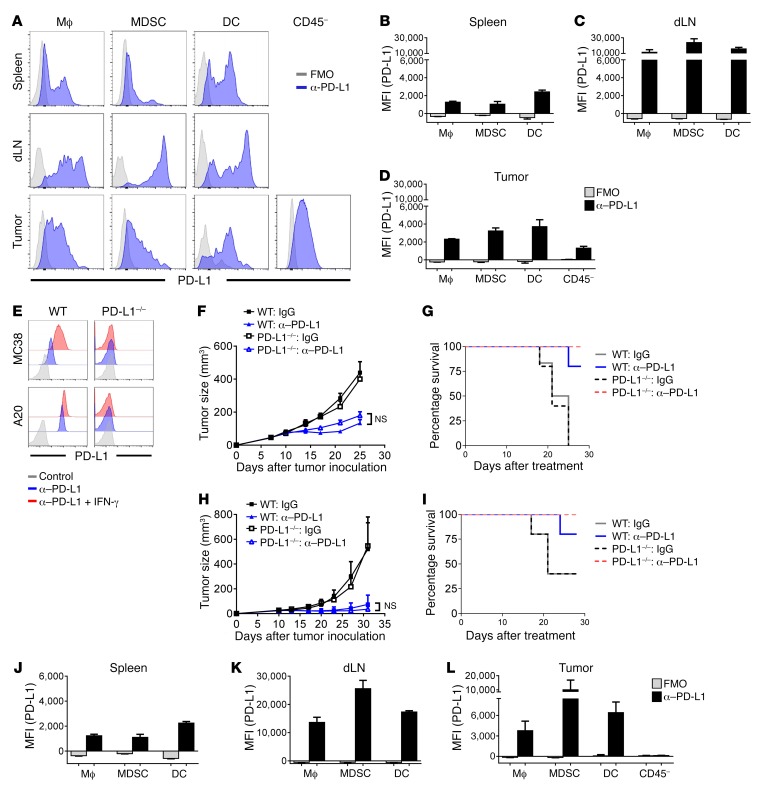
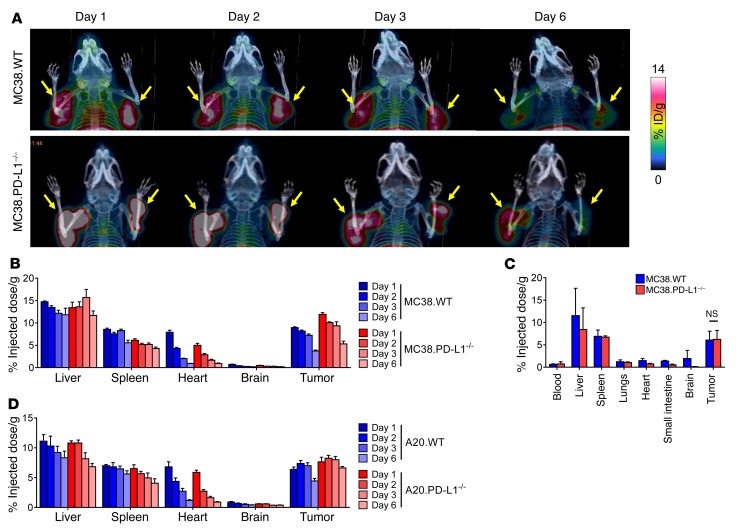
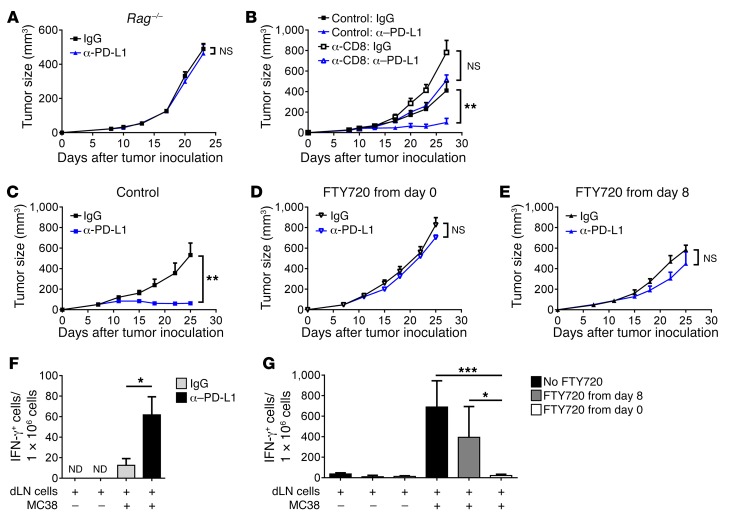
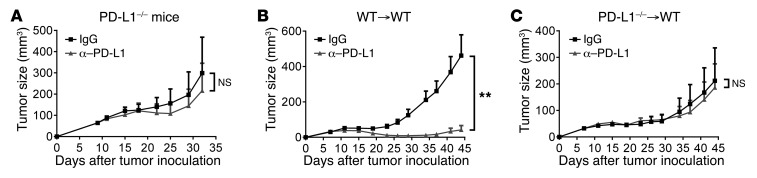
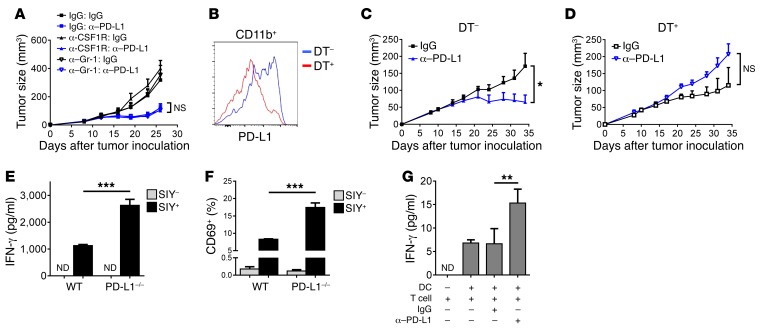
Programmed death-ligand 1 (PD-L1) expression on tumor cells is essential for T cell impairment, and PD-L1 blockade therapy has shown unprecedented durable responses in several clinical studies. Although higher expression of PD-L1 on tumor cells is associated with a better immune response after Ab blockade, some PD-L1-negative patients also respond to this therapy. In the current study, we explored whether PD-L1 on tumor or host cells was essential for anti-PD-L1-mediated therapy in 2 different murine tumor models. Using real-time imaging in whole tumor tissues, we found that anti-PD-L1 Ab accumulates in tumor tissues, regardless of the status of PD-L1 expression on tumor cells. We further observed that, while PD-L1 on tumor cells was largely dispensable for the response to checkpoint blockade, PD-L1 in host myeloid cells was essential for this response. Additionally, PD-L1 signaling in defined antigen-presenting cells (APCs) negatively regulated and inhibited T cell activation. PD-L1 blockade inside tumors was not sufficient to mediate regression, as limiting T cell trafficking reduced the efficacy of the blockade. Together, these findings demonstrate that PD-L1 expressed in APCs, rather than on tumor cells, plays an essential role in checkpoint blockade therapy, providing an insight into the mechanisms of this therapy.

Keywords: Cancer immunotherapy; Cellular immune response; Immunology; Oncology.


Conflict of interest statement

Conflict of interest: The authors have declared that no conflict of interest exists.

Figures

Figure 1
Figure 1. Tumor-expressed PD-L1 is dispensable for responses to checkpoint blockade therapy.
(A) C57BL/6 mice were inoculated with 1 × 10⁶ MC38 cells. Spleen, dLN, and tumor tissues were collected on day 22. PD-L1 expression was measured by flow cytometry. FMO, fluorescence minus one. (BD) Mean fluorescent intensities (MFIs) of PD-L1 staining in spleen (B), dLN (C), and tumor (D) are shown (n = 3 per group). (E) PD-L1 expression in MC38.WT, MC38.PD-L1–/–, A20.WT, and A20.PD-L1–/– cells was measured by flow cytometry. To induce PD-L1 expression, cells were treated with 500 U/ml IFN-γ for 24 hours. (F and G) C57BL/6 mice (n = 5 or 6) were inoculated with 1 × 10⁶ MC38.WT or MC38.PD-L1–/– cells. After tumors were established, mice were treated with 200 μg anti–PD-L1 on days 7, 10, and 13. Tumor growth (F) and survival curve (G) are shown. (H and I) BALB/c mice (n = 5) were inoculated with 3 × 10⁶ A20.WT or A20.PD-L1–/– cells. Mice were treated with 200 μg anti–PD-L1 on days 10 and 13. Tumor growth (H) and survival curve (I) are shown. (JL) Tissues were collected from MC38.PD-L1–/– tumor-bearing mice. Mean fluorescent intensities of PD-L1 staining in spleen (J), dLN (K), and tumor (L) are shown (n = 3). Data indicate mean ± SEM and are representative of at least 2 independent experiments. Statistical analysis was performed using an unpaired Student’s 2-tailed t test.
Figure 2
Figure 2. Anti–PD-L1 Ab targeting to tumor tissue is independent of tumor PD-L1.
(A) MC38.WT or MC38.PD-L1–/– tumor-bearing mice were injected with 50 μCi of 89Zr-radiolabeled deferoxamine-conjugated anti–PD-L1 (89Zr-anti–PD-L1) Abs (n = 3 per group). Ab distribution was imaged by PET/CT on 1, 2, 3, and 6 d.p.i. One representative mouse from each group is shown. Yellow arrows indicate tumors. (B) The uptake of 89Zr–anti–PD-L1 Abs in MC38 tumors was measured by PET/CT and quantitated in various organs on 1, 2, 3, and 6 d.p.i. (C) Ex vivo biodistribution of 89Zr–anti–PD-L1 Ab uptake on 6 d.p.i. is shown. (D) The uptake of 89Zr–anti–PD-L1 Abs was measured and quantitated by PET/CT in mice bearing A20.WT or A20.PD-L1–/– tumors (n = 3 per group). Statistical analysis was performed using an unpaired Student’s 2-tailed t test.
Figure 3
Figure 3. Preexisting TIL is insufficient for the effects of PD-L1 blockade.
(A) B6.Rag–/– mice (n = 5) were inoculated with 1 × 10⁶ MC38 cells. After tumors were established, mice were treated with 200 μg anti–PD-L1 on days 8 and 11. Tumor growth was measured twice a week. (B) C57BL/6 mice (n = 5) were inoculated with 1 × 10⁶ MC38 cells. Mice were treated with 200 μg anti–PD-L1 on days 8 and 11. For CD8+ T cell depletion, mice were treated with 200 μg anti-CD8 on days 8, 11, and 14. (CE) MC38 tumor–bearing mice (n = 5 per group) were treated with 200 μg IgG or anti–PD-L1 on days 8 and 11. Mice were also treated with control (C) or FTY720 from day 0 (D) or day 8 (E). (F) MC38 tumor-bearing mice were treated with IgG or anti–PD-L1 (n = 3 per group). Two days later, dLN were isolated and single-cell suspensions were prepared. Cells were cocultured with or without MC38 cells for 2 days. IFN-γ+ cells were measured by ELISPOT. (G) MC38 tumor–bearing mice were treated with anti–PD-L1 and FTY720 as in CE. Three days after anti–PD-L1 treatment, dLNs were isolated. ELISPOT assay was performed. Data indicate mean ± SEM and are representative of 2 independent experiments. Statistical analysis was performed using an unpaired Student’s 2-tailed t test. *P < 0.05; **P < 0.01; ***P < 0.001. ND, not detectable.
Figure 4
Figure 4. Host PD-L1 is essential for the responses to PD-L1 blockade.
(A) PD-L1–/– mice were inoculated with 1 × 10⁶ WT MC38 cells. Mice were treated with 200 μg IgG or anti–PD-L1 on days 9 and 12 (n = 4). Tumor growth was measured twice weekly. (B and C) C57BL/6 mice were reconstituted with bone marrow cells from WT (B) or PD-L1–/– (C) mice. Eight weeks after reconstitution, mice were inoculated with 1 × 10⁶ MC38 cells and treated with 200 μg anti–PD-L1 on days 7, 10, and 13 (n = 7 for WT, n = 5 for PD-L1–/–). Data indicate mean ± SEM and are from a pool of 2 independent experiments. Statistical analysis was performed using an unpaired Student’s 2-tailed t test. **P < 0.01.
Figure 5
Figure 5. PD-L1 signaling in myeloid cells harnesses antitumor immunity.
(A) C57BL/6 mice (n = 5) were inoculated with 1 × 10⁶ WT MC38 cells and treated with 200 μg IgG or anti–PD-L1 on days 9 and 12. For cell depletion, 300 μg IgG, anti-CSF1R, or anti–Gr-1 Abs were injected from day 8. (BD) C57BL/6 mice were reconstituted with mixed bone marrow cells from CD11b-DTR and PD-L1–/– mice. Eight weeks after reconstitution, mice were inoculated with 1 × 10⁶ MC38 cells and treated with 200 μg anti–PD-L1 treatment on days 11 and 14 (n = 5). DT was injected intraperitoneally every other day from day 11. Twenty-four hours after the second DT injection, PD-L1 levels in tumor-infiltrating-CD11b+ cells were measured by flow cytometry (B). Tumor growth without (C) or with (D) DT was measured twice a week. (E and F) BMDMs from WT or PD-L1–/– mice were loaded with SIY peptide, then cocultured with 2C T cells for 3 days. (E) IFN-γ levels in culture supernatant were measured by CBA. (F) T cell activation was evaluated by flow cytometry. (G) DCs and CD8+ T cells were isolated from dLNs of MC38 tumor–bearing mice and cocultured for 4 days. Anti–PD-L1 or control IgG was added into medium at a concentration of 10 μg/ml. Cell culture supernatants were harvested, and IFN-γ levels were measured by CBA. Data indicate mean ± SEM and are representative of 2 (A, B, G) or 3 (E, F), or a pool of 2 (C, D) independent experiments. Statistical analysis was performed using an unpaired Student’s 2-tailed t test. *P < 0.05; **P < 0.01; ***P < 0.001.

Comment in

References

    1. Zou W, Wolchok JD, Chen L. PD-L1 (B7-H1) and PD-1 pathway blockade for cancer therapy: Mechanisms, response biomarkers, and combinations. Sci Transl Med. 2016;8(328):328rv4. doi: 10.1126/scitranslmed.aad7118. - DOI - PMC - PubMed
    1. Topalian SL, et al. Safety, activity, and immune correlates of anti-PD-1 antibody in cancer. N Engl J Med. 2012;366(26):2443–2454. doi: 10.1056/NEJMoa1200690. - DOI - PMC - PubMed
    1. Brahmer JR, et al. Safety and activity of anti-PD-L1 antibody in patients with advanced cancer. N Engl J Med. 2012;366(26):2455–2465. doi: 10.1056/NEJMoa1200694. - DOI - PMC - PubMed
    1. Sznol M, Chen L. Antagonist antibodies to PD-1 and B7-H1 (PD-L1) in the treatment of advanced human cancer. Clin Cancer Res. 2013;19(5):1021–1034. doi: 10.1158/1078-0432.CCR-12-2063. - DOI - PMC - PubMed
    1. Iwai Y, Ishida M, Tanaka Y, Okazaki T, Honjo T, Minato N. Involvement of PD-L1 on tumor cells in the escape from host immune system and tumor immunotherapy by PD-L1 blockade. Proc Natl Acad Sci U S A. 2002;99(19):12293–12297. doi: 10.1073/pnas.192461099. - DOI - PMC - PubMed

Publication types