. 2018 Feb 1;128(2):805-815.
doi: 10.1172/JCI96113. Epub 2018 Jan 16.

Host expression of PD-L1 determines efficacy of PD-L1 pathway blockade-mediated tumor regression

Affiliations

Host expression of PD-L1 determines efficacy of PD-L1 pathway blockade-mediated tumor regression

Heng Lin et al. J Clin Invest. .

Erratum in

Abstract

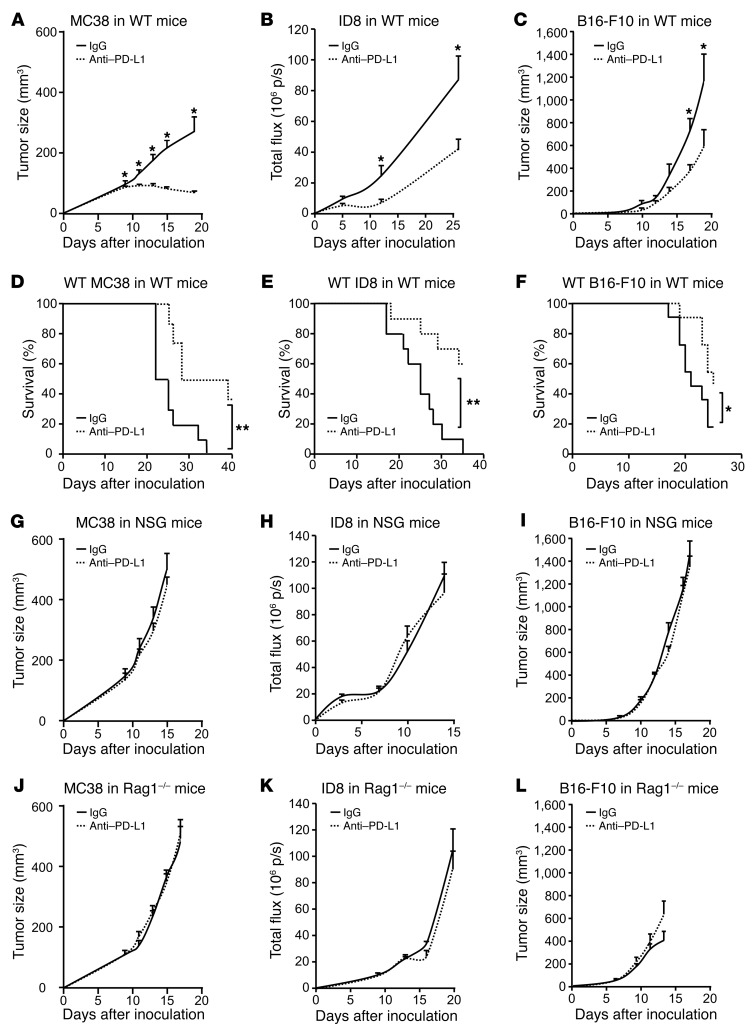
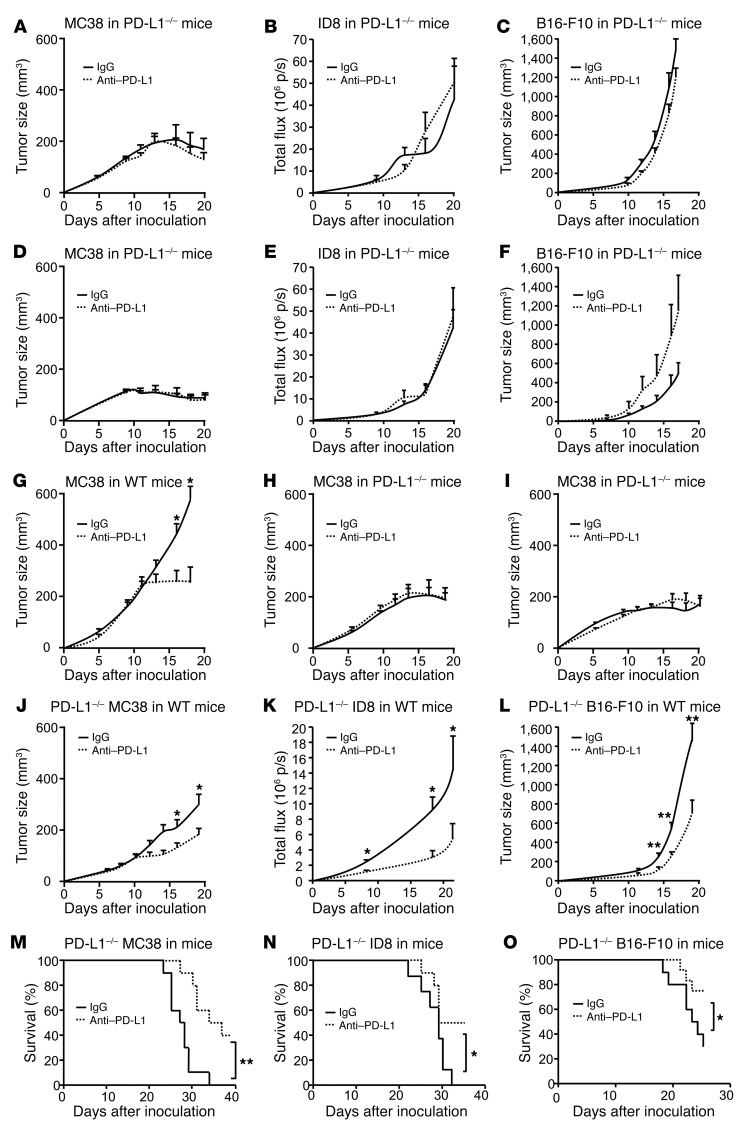
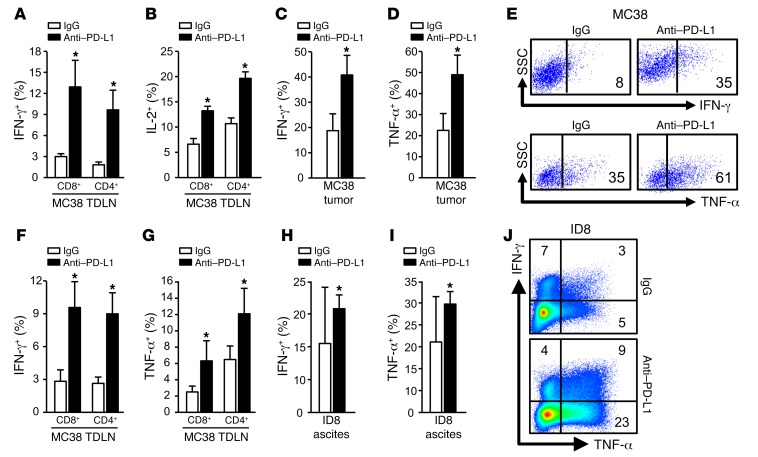
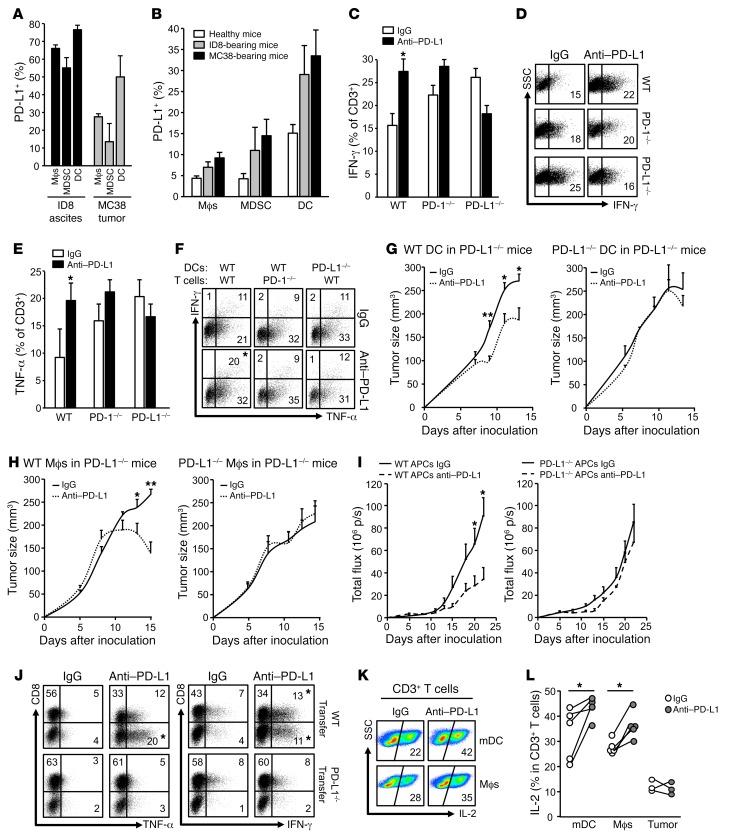
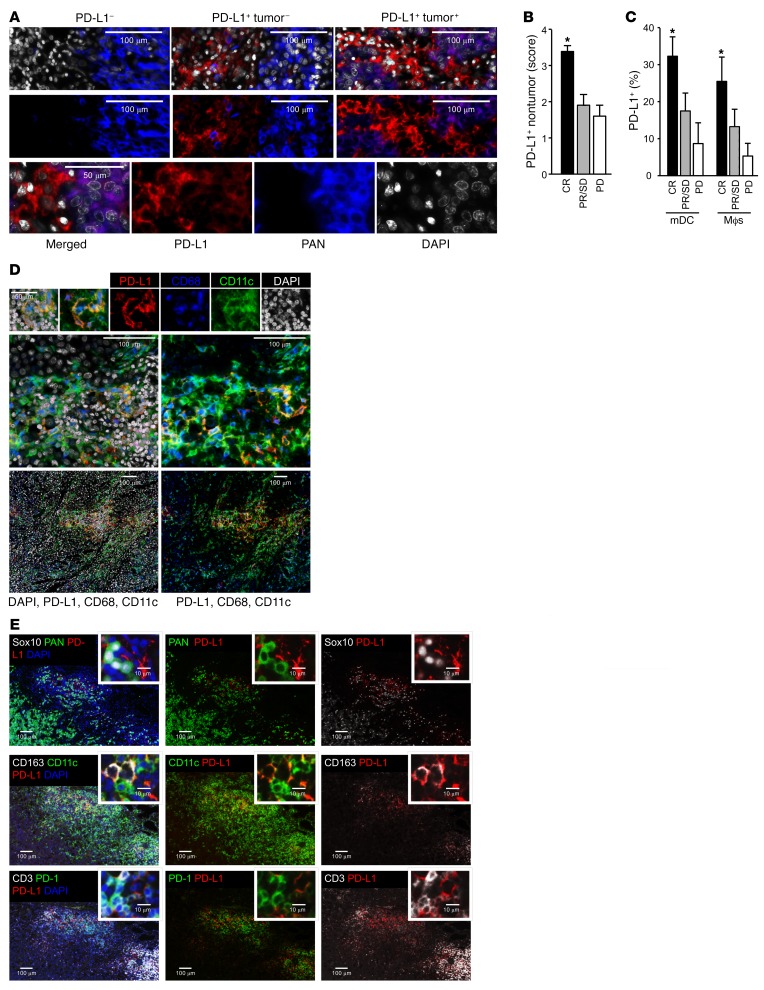
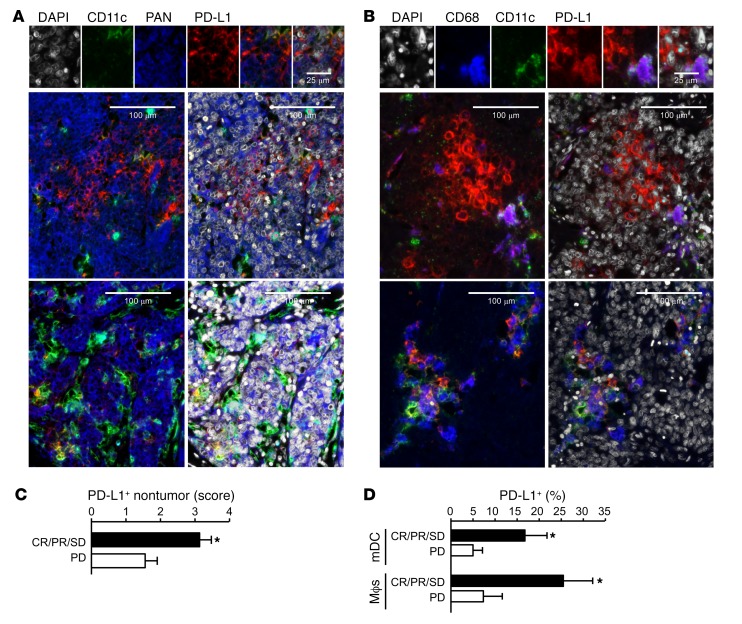
Programmed death-1 receptor (PD-L1, B7-H1) and programmed cell death protein 1 (PD-1) pathway blockade is a promising therapy for treating cancer. However, the mechanistic contribution of host and tumor PD-L1 and PD-1 signaling to the therapeutic efficacy of PD-L1 and PD-1 blockade remains elusive. Here, we evaluated 3 tumor-bearing mouse models that differ in their sensitivity to PD-L1 blockade and demonstrated a loss of therapeutic efficacy of PD-L1 blockade in immunodeficient mice and in PD-L1- and PD-1-deficient mice. In contrast, neither knockout nor overexpression of PD-L1 in tumor cells had an effect on PD-L1 blockade efficacy. Human and murine studies showed high levels of functional PD-L1 expression in dendritic cells and macrophages in the tumor microenvironments and draining lymph nodes. Additionally, expression of PD-L1 on dendritic cells and macrophages in ovarian cancer and melanoma patients correlated with the efficacy of treatment with either anti-PD-1 alone or in combination with anti-CTLA-4. Thus, PD-L1-expressing dendritic cells and macrophages may mechanistically shape and therapeutically predict clinical efficacy of PD-L1/PD-1 blockade.

Keywords: Cancer immunotherapy; Immunology.


Conflict of interest statement

Conflict of interest: M. Wicha and W. Zou received a sponsored research grant from MedImmune. J. Hamanishi and M. Mandai received Nivolumab and its safety data in their physician-initiated clinical trial (UMIN000005714) from Ono Pharmaceutical Co. and Bristol-Myers Squibb. L.A. Fecher received clinical trial funding from Bristol Myers Squibb.

Figures

Figure 1
Figure 1. Effect of anti–PD-L1 on tumor growth in tumor-bearing mice.
(AL) WT, NSG, and Rag1–/– mice were inoculated with MC38, ID8, and B16-F10 tumor cells. Treatment with anti–PD-L1 or isotype control (rIgG1) was initiated on day 3 and continued every 3 days. Tumor volume and mouse survival were monitored. AC, n= 8–11; DF, n= 10–11; GL, n = 5–11. Wilcoxon test was used for 2-way comparisons. Kaplan-Meier method was used for analyzing survival.*P < 0.05; **P < 0.01. p/s, photons per second.
Figure 2
Figure 2. Effect of anti–PD-L1 and anti–PD-1 on tumor volume in tumor-bearing mice.
(AF) PD-L1–/– and PD-1–/– mice were inoculated with MC38, ID8, and B16-F10 tumor cells and treated with anti–PD-L1 or isotype control (rIgG1). Tumor volume was monitored. (GI) WT, PD-L1–/–, and PD-1–/– mice were inoculated with MC38 tumor cells and treated with anti–PD-1 or isotype control. Tumor volume was monitored. (JO) PD-L1–/– MC38, ID8, and B16-F10 tumor cells were inoculated into WT mice. Mice were treated with anti–PD-L1 or isotype control. Tumor volume and mouse survival were monitored. AF, n= 5–7; GI, n= 7–9; JL, n = 10–20; MO, n = 8–10. Wilcoxon test was used for 2-way comparisons. Kaplan-Meier method was used for analyzing survival. *P < 0.05; **P < 0.01.
Figure 3
Figure 3. T cell effector cytokine expression induced by anti–PD-L1 therapy.
(AJ) T cell effector cytokines were analyzed with intracellular staining in MC38 TDLNs (A and B), MC38 tumor tissues (CE), ID8 TDLN (F and G), and ID8 tumor ascites (HJ). Data are expressed as mean ± SEM (n = 3–5 per group). Representative original flow cytometry data are shown (E and J). Wilcoxon test was used for 2-way comparisons. *P < 0.05.
Figure 4
Figure 4. Expression and role of APC PD-L1 in immunosuppression.
(A and B) PD-L1 expression in immune cells in MC38 tumors and ID8 ascites (A) and TDLNs (B). PD-L1 expression was analyzed by flow cytometry analysis in immune cell subsets in tumor tissues. Data are expressed as mean ± SEM. n = 3. (CF) Effect of anti–PD-L1 on T cell effector cytokine expression. WT, PD-1–/–, and PD-L1–/– splenocytes were activated with anti-CD3, anti-CD28, and anti–PD-L1 or isotype control. T cell IFN-γ (C and D) and TNF-α (E) production were measured by flow cytometry. Results are expressed as mean ± SEM (n = 3). t test was used for 2-way comparisons. *P < 0.05. (F) Effect of anti–PD-L1 on T cell effector cytokine expression. WT and PD-1–/– T cells were activated in the presence of WT or PD-L1–/– DCs. T cell IFN-γ and TNF-α production in T cells in the presence of anti–PD-L1 or isotype control. Representative replicates are shown. n = 3. t test was used for 2-way comparisons. *P < 0.05. (G and H) PD-L1–/– mice were adoptively transferred with WT or PD-L1–/– DCs or macrophages. Mice were given MC38 tumor cells and treated with anti–PD-L1 or isotype control (rIgG1). n = 3–7. Tumor volume was monitored. Wilcoxon test was used for 2-way comparisons. *P < 0.05; **P < 0.01. (I and J) ID8 tumor–associated peritoneal WT and PD-L1–/– APCs were transferred into ID8 tumor–bearing PD-L1–/– mice. These mice were treated with anti–PD-L1 and isotype IgG1. (I) Tumor progression was monitored by Xenogen IVIS Spectrum. (J) T cell effector cytokines were analyzed with intracellular staining in ID8 tumor ascites. t test was used for 2-way comparisons. n = 7. *P < 0.05. (K and L) Effect of anti–PD-L1 on human T cell cytokine expression. Human T cells were activated with anti-CD3 and anti-CD28 and DCs, macrophages, or fixed tumor cells. T cell IL-2 production was analyzed by flow cytometry analysis. Data are expressed as representative flow cytometry analysis data (K) and individual dot points for each sample (L). n = 5. Wilcoxon test was used for 2-way comparisons. *P < 0.05.
Figure 5
Figure 5. Relationship between PD-L1+ APCs and clinical response to PD-1 blockade in patients with metastatic melanoma.
(AE) Multiplexed immunofluorescence analysis of PD-L1 expression in metastatic melanoma tissues (AD) and draining lymph nodes (E). (A) Representative image of PD-L1 expression (red) in tumor cells (PAN-melanoma, blue) and nontumor cells in melanoma tissues. (B) PD-L1 expression score was quantified in nontumor cells in patients with complete response (CR), partial response (PR), stable disease (SD), and progressive disease (PD). *P < 0.05. (C) Percentages of PD-L1 expression were quantified in mDCs and macrophages in patients with complete response, partial response, stable disease, and progressive disease. *P < 0.05. (D) Representative images of PD-L1 expression (red) in mDCs (CD11c, green) and macrophages (CD68, blue) in metastatic melanoma tissues. (E) Representative images of PD-L1 expression (red) in APCs (CD11c for DCs, CD163 for macrophages) and tumor cells (Sox10 and Pan-melanoma) in the melanoma-draining lymph nodes. The colocalization of PD-L1+ APCs and PD-1+ T cells is shown.
Figure 6
Figure 6. Relationship between PD-L1+ APCs and clinical response to PD-1 blockade in patients with ovarian carcinoma.
(AD) Multiplexed immunofluorescence analysis of PD-L1 expression in ovarian cancer tissues. (A and B) Representative images of PD-L1 expression (red) in ovarian cancer cells (PAN-keratin) and APC subsets in ovarian cancer tissues. (C) PD-L1 expression score was quantified in nontumor cells in patients with clinical responses (complete response, partial response, and stable disease) and progressive disease. *P < 0.05. (D) Percentages of PD-L1 expression were quantified in mDCs and macrophages in ovarian cancer patients with clinical responses (complete response, partial response, and stable disease) and progressive disease. *P < 0.05.

Comment in

References

    1. Topalian SL, Drake CG, Pardoll DM. Immune checkpoint blockade: a common denominator approach to cancer therapy. Cancer Cell. 2015;27(4):450–461. doi: 10.1016/j.ccell.2015.03.001. - DOI - PMC - PubMed
    1. Zou W, Wolchok JD, Chen L. PD-L1 (B7-H1) and PD-1 pathway blockade for cancer therapy: Mechanisms, response biomarkers, and combinations. Sci Transl Med. 2016;8(328):328rv4. doi: 10.1126/scitranslmed.aad7118. - DOI - PMC - PubMed
    1. DuPage M, Mazumdar C, Schmidt LM, Cheung AF, Jacks T. Expression of tumour-specific antigens underlies cancer immunoediting. Nature. 2012;482(7385):405–409. doi: 10.1038/nature10803. - DOI - PMC - PubMed
    1. Matsushita H, et al. Cancer exome analysis reveals a T-cell-dependent mechanism of cancer immunoediting. Nature. 2012;482(7385):400–404. doi: 10.1038/nature10755. - DOI - PMC - PubMed
    1. Tran E, et al. Cancer immunotherapy based on mutation-specific CD4+ T cells in a patient with epithelial cancer. Science. 2014;344(6184):641–645. doi: 10.1126/science.1251102. - DOI - PMC - PubMed

Publication types

MeSH terms