. 2018 Jan 16;18(1):244.
doi: 10.3390/s18010244.

Monitoring Strategies of Earth Dams by Ground-Based Radar Interferometry: How to Extract Useful Information for Seismic Risk Assessment

Affiliations

Monitoring Strategies of Earth Dams by Ground-Based Radar Interferometry: How to Extract Useful Information for Seismic Risk Assessment

Andrea Di Pasquale et al. Sensors (Basel). .

Abstract

The aim of this paper is to describe how ground-based radar interferometry can provide displacement measurements of earth dam surfaces and of vibration frequencies of its main concrete infrastructures. In many cases, dams were built many decades ago and, at that time, were not equipped with in situ sensors embedded in the structure when they were built. Earth dams have scattering properties similar to landslides for which the Ground-Based Synthetic Aperture Radar (GBSAR) technique has been so far extensively applied to study ground displacements. In this work, SAR and Real Aperture Radar (RAR) configurations are used for the measurement of earth dam surface displacements and vibration frequencies of concrete structures, respectively. A methodology for the acquisition of SAR data and the rendering of results is described. The geometrical correction factor, needed to transform the Line-of-Sight (LoS) displacement measurements of GBSAR into an estimate of the horizontal displacement vector of the dam surface, is derived. Furthermore, a methodology for the acquisition of RAR data and the representation of displacement temporal profiles and vibration frequency spectra of dam concrete structures is presented. For this study a Ku-band ground-based radar, equipped with horn antennas having different radiation patterns, has been used. Four case studies, using different radar acquisition strategies specifically developed for the monitoring of earth dams, are examined. The results of this work show the information that a Ku-band ground-based radar can provide to structural engineers for a non-destructive seismic assessment of earth dams.

Keywords: Real Aperture Radar (RAR); SAR interferometry; Synthetic Aperture Radar (SAR); earth dam; ground-based radar.


Conflict of interest statement

The authors declare no conflict of interest.

Figures

Figure 1
Figure 1
Geometry for the rendering of GBSAR displacement maps over a Digital Elevation Model (DEM). The range and displacement vectors are shown in red and green, respectively.
Figure 2
Figure 2
(a) Range distance R; (b) azimuth angle ψ; (c) vertical angle ξ.
Figure 2
Figure 2
(a) Range distance R; (b) azimuth angle ψ; (c) vertical angle ξ.
Figure 3
Figure 3
LoS factor spatial distribution over the dam mesh.
Figure 4
Figure 4
Sketch of the proposed methodology for the processing of ground-based SAR data: (a) geolocation, correction for the LoS factor and 3D rendering of displacement measurement; (b) merging of displacement measurement for the estimation of the geolocation displacement vectors.
Figure 5
Figure 5
Sketch of the proposed methodology for the processing of ground-based RAR data.
Figure 6
Figure 6
Google© snapshots of (a) Marana-Capacciotti dam on the Ofanto river, Cerignola; (b) Capaccio dam on the Celone stream, Lucera; (c) Occhito dam on the Fortore river, Carlantino and (d) San Pietro dam on the Osento stream, Aquilonia. The GBSAR installation sites are also shown.
Figure 6
Figure 6
Google© snapshots of (a) Marana-Capacciotti dam on the Ofanto river, Cerignola; (b) Capaccio dam on the Celone stream, Lucera; (c) Occhito dam on the Fortore river, Carlantino and (d) San Pietro dam on the Osento stream, Aquilonia. The GBSAR installation sites are also shown.
Figure 7
Figure 7
Acquisition geometry at the Marana-Capacciotti dam: (a) Map of the dam downstream surface re-projected in the Cartesian reference system centered at the GBSAR rail center and with the x-axis given by the rail direction. The GBSAR is located at the position (x = 0, y = 0); (b) photo of the dam surface taken from the GBSAR installation site.
Figure 8
Figure 8
Marana-Capacciotti dam, Cerignola. NRCS and interferometric coherence displayed in radar coordinates (a,b), Cartesian coordinates (c,d) and rendered on a Digital Elevation Model (DEM) of the dam (e,f).
Figure 8
Figure 8
Marana-Capacciotti dam, Cerignola. NRCS and interferometric coherence displayed in radar coordinates (a,b), Cartesian coordinates (c,d) and rendered on a Digital Elevation Model (DEM) of the dam (e,f).
Figure 8
Figure 8
Marana-Capacciotti dam, Cerignola. NRCS and interferometric coherence displayed in radar coordinates (a,b), Cartesian coordinates (c,d) and rendered on a Digital Elevation Model (DEM) of the dam (e,f).
Figure 9
Figure 9
Marana-Capacciotti dam, Cerignola. Amplitude of the horizontal displacement map represented over the dam surface.
Figure 10
Figure 10
Capaccio dam, Lucera. (a) Photo of the dam as observed by the GBSAR position; (b) NRCS; (c) interferometric coherence and (d) displacement map in Cartesian coordinates.
Figure 10
Figure 10
Capaccio dam, Lucera. (a) Photo of the dam as observed by the GBSAR position; (b) NRCS; (c) interferometric coherence and (d) displacement map in Cartesian coordinates.
Figure 11
Figure 11
Occhito dam, Carlantino. (a,b) photo of the dam as observed from the GBSAR positions; (c,d) interferometric coherence (c,d); (e,f) displacement maps in Cartesian coordinates. Data have been collected by two GBSAR systems installed on the left (SX) and right (DX) downstream sides of the dam, respectively.
Figure 11
Figure 11
Occhito dam, Carlantino. (a,b) photo of the dam as observed from the GBSAR positions; (c,d) interferometric coherence (c,d); (e,f) displacement maps in Cartesian coordinates. Data have been collected by two GBSAR systems installed on the left (SX) and right (DX) downstream sides of the dam, respectively.
Figure 12
Figure 12
San Pietro dam, Aquilonia. (a,b) photo of the dam as observed from the GBSAR positions; (c,d) interferometric coherence; (e,f) displacement maps in Cartesian coordinates. Data have been collected by two GBSAR systems installed on upper (UP) and downstream (DOWN) sides of the dam, respectively.
Figure 12
Figure 12
San Pietro dam, Aquilonia. (a,b) photo of the dam as observed from the GBSAR positions; (c,d) interferometric coherence; (e,f) displacement maps in Cartesian coordinates. Data have been collected by two GBSAR systems installed on upper (UP) and downstream (DOWN) sides of the dam, respectively.
Figure 13
Figure 13
Occhito dam, Carlantino. Monitoring of the footbridge.
Figure 14
Figure 14
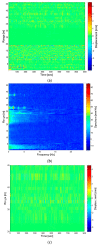
Occhito dam, Carlantino. Monitoring of the pedestrian bridge. Holistic view of (a) displacements and (b) frequency spectrum of all targets observed by the GBSAR. Frequency peaks can be observed in the range distance intervals [30 m, 35 m] and [40 m, 45 m]. Details of the (c) displacement and (d) frequency spectrum with the peaks at 1.6 Hz and 2 Hz.
Figure 14
Figure 14
Occhito dam, Carlantino. Monitoring of the pedestrian bridge. Holistic view of (a) displacements and (b) frequency spectrum of all targets observed by the GBSAR. Frequency peaks can be observed in the range distance intervals [30 m, 35 m] and [40 m, 45 m]. Details of the (c) displacement and (d) frequency spectrum with the peaks at 1.6 Hz and 2 Hz.
Figure 15
Figure 15
Occhito dam, Carlantino. Time series of displacements (left) and corresponding frequency spectrum (right) of targets belonging to the pedestrian bridge located at range distance in the interval [30 m, 35 m].
Figure 16
Figure 16
Occhito dam, Carlantino. Time series of displacements (left) and corresponding frequency spectrum (right) of targets belonging to the pedestrian bridge located at range distance in the interval [40 m, 45 m].
Figure 17
Figure 17
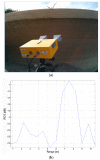
San Pietro dam, Aquilonia. Monitoring of the chalice-shaped spillway. (a) observation geometry with detail of the antennas used for the data acquisition; (b) Radar cross-section of the radar signal scattered by the structure vs. the range distance from the radar.
Figure 18
Figure 18
San Pietro dam, Aquilonia. Monitoring of the chalice-shaped spillway. Maps with (a) displacement time-series and (b) vibration spectrum of targets located at range distances between 6 and 9 m.
Figure 18
Figure 18
San Pietro dam, Aquilonia. Monitoring of the chalice-shaped spillway. Maps with (a) displacement time-series and (b) vibration spectrum of targets located at range distances between 6 and 9 m.
Figure 19
Figure 19
San Pietro dam, Aquilonia. (left) time series of displacements; (right) corresponding frequency spectrum of targets belonging to the chalice-shaped spillway located at range distance in the interval [5 m, 10 m].

References

    1. Massonnet D., Feigl K.L. Radar interferometry and its application to changes in the Earth’s surface. Rev. Geophys. 1998;36:441–500. doi: 10.1029/97RG03139. - DOI
    1. Prats P., Reigber A., Mallorqui J.J., Scheiber R., Moreira A. Estimation of the temporal evolution of the deformation using airborne differential SAR interferometry. IEEE Trans. Geosci. Remote Sens. 2008;46:1065–1078. doi: 10.1109/TGRS.2008.915758. - DOI
    1. Montserrat O., Crosetto M., Luzi G. A review of ground-based SAR interferometry for deformation measurement. ISPRS J. Photogramm. Remote Sens. 2014;93:40–48. doi: 10.1016/j.isprsjprs.2014.04.001. - DOI
    1. Oliveira S.C., Zezêre J.L., Catalão J., Nico G. The contribution of PSInSAR interferometry to landslide hazard in weak rock-dominated areas. Landslides. 2015;12:703–719. doi: 10.1007/s10346-014-0522-9. - DOI
    1. Leva D., Nico G., Tarchi D., Fortuny-Guasch J., Sieber A.J. Temporal analysis of a landslide by means of a ground-based SAR interferometer. IEEE Trans. Geosci. Remote Sens. 2003;41:745–752. doi: 10.1109/TGRS.2003.808902. - DOI