. 2018 Jan 16;14(1):e1005896.
doi: 10.1371/journal.pcbi.1005896. eCollection 2018 Jan.

Clustering gene expression time series data using an infinite Gaussian process mixture model

Affiliations

Clustering gene expression time series data using an infinite Gaussian process mixture model

Ian C McDowell et al. PLoS Comput Biol. .

Abstract

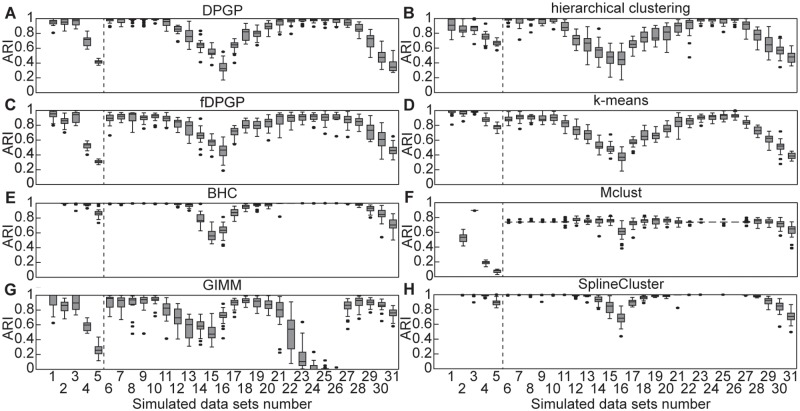
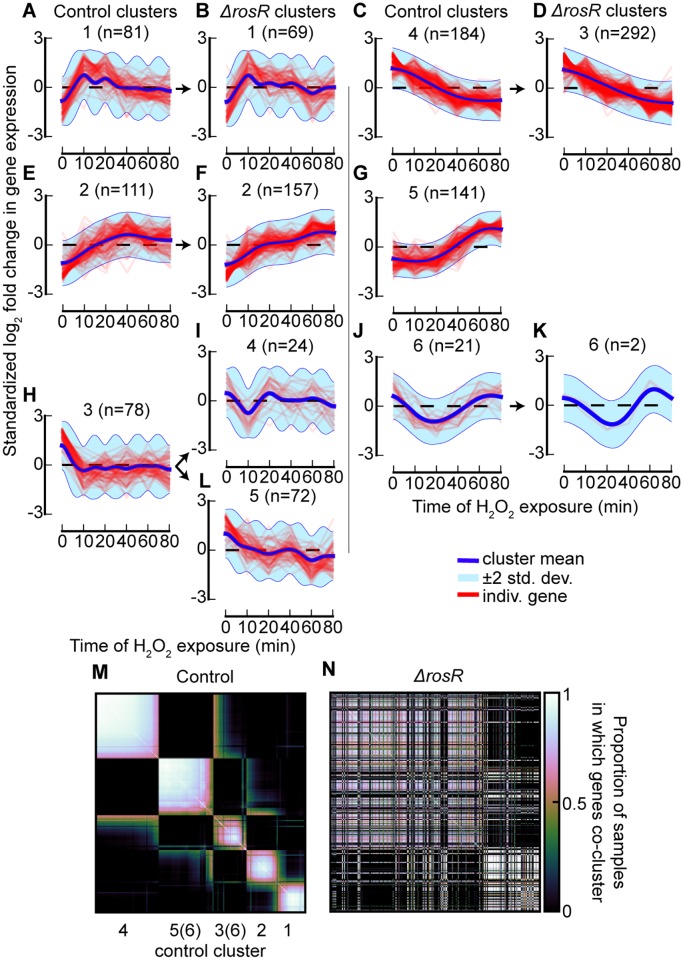
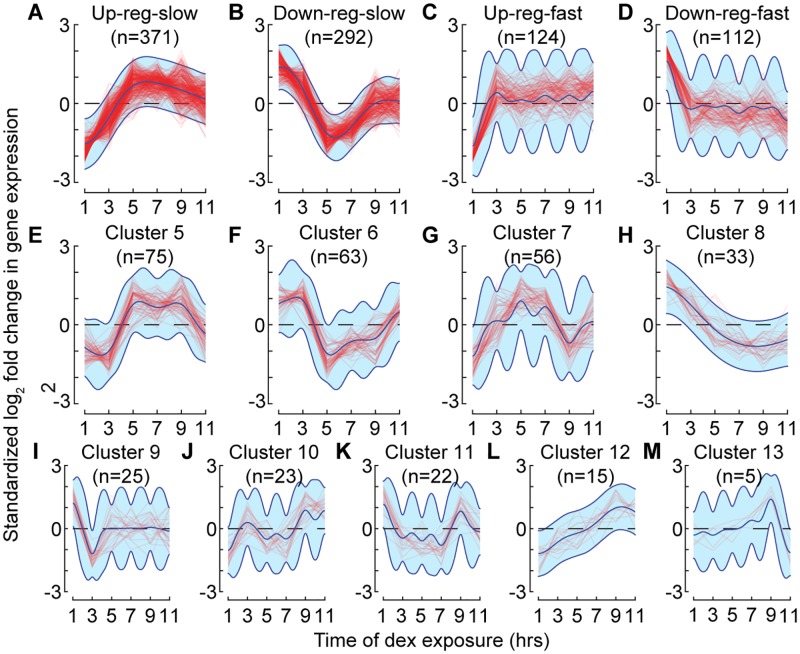
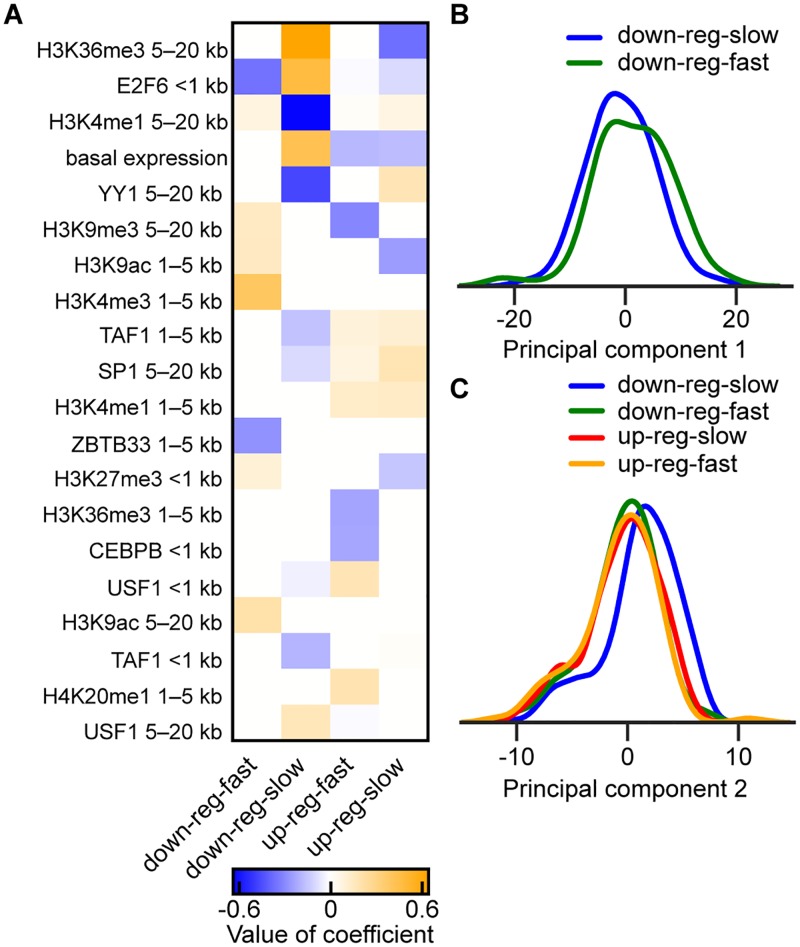
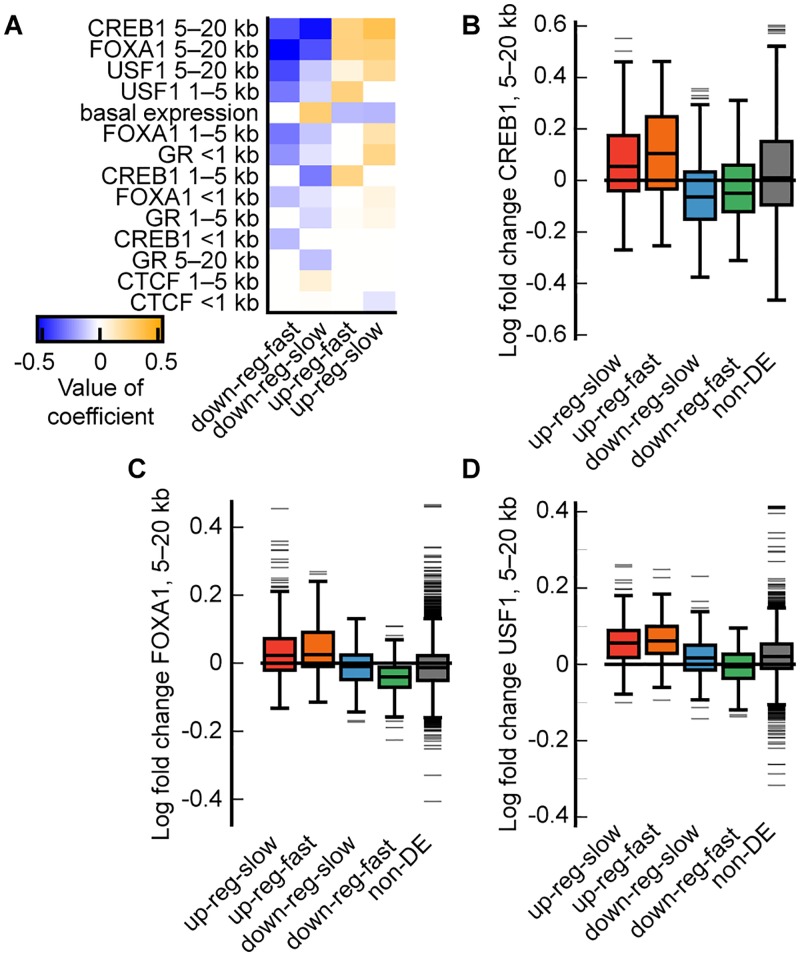
Transcriptome-wide time series expression profiling is used to characterize the cellular response to environmental perturbations. The first step to analyzing transcriptional response data is often to cluster genes with similar responses. Here, we present a nonparametric model-based method, Dirichlet process Gaussian process mixture model (DPGP), which jointly models data clusters with a Dirichlet process and temporal dependencies with Gaussian processes. We demonstrate the accuracy of DPGP in comparison to state-of-the-art approaches using hundreds of simulated data sets. To further test our method, we apply DPGP to published microarray data from a microbial model organism exposed to stress and to novel RNA-seq data from a human cell line exposed to the glucocorticoid dexamethasone. We validate our clusters by examining local transcription factor binding and histone modifications. Our results demonstrate that jointly modeling cluster number and temporal dependencies can reveal shared regulatory mechanisms. DPGP software is freely available online at https://github.com/PrincetonUniversity/DP_GP_cluster.


Conflict of interest statement

The authors have declared that no competing interests exist.

Figures

Fig 1
Fig 1. Clustering performance of state-of-the-art algorithms on simulated time series data.
Box plots show summaries of the empirical distribution of clustering performance for (A) DPGP, (B) hierarchical clustering, (C) fDPGP, (D), k-means clustering, (E) BHC, (F) Mclust, (G) GIMM, and (H) SplineCluster in terms of Adjusted Rand Index (ARI) across twenty instances of each of the 31 data set types (S1 Table). Higher values represent better recovery of the simulated clusters. Vertical dotted lines separate data sets with widely varied cluster size distributions (left) from data sets with widely varied generating hyperparameters (right). Observations that lie beyond the first or third quartile by 1.5× the interquartile range are shown as outliers.
Fig 2
Fig 2. DPGP clusters in H. salinarum H2O2-exposed gene expression trajectories.
(A–L) For each cluster, standardized log2 fold change in expression from pre-exposure levels is shown for each gene as well as the posterior cluster mean ±2 standard deviations. Control strain clusters are on left and ΔrosR clusters on right, organized to relate the ΔrosR clusters that correspond to each control cluster. Note that control cluster 5 had no corresponding ΔrosR cluster, but transcripts in this cluster instead distribute to a variety of ΔrosR clusters, none of which had a majority of cluster 5 transcripts. (M) Heatmap displays the proportion of DPGP samples from the Markov chain in which each gene (on the rows and columns) clusters with every other gene in the control strain. Rows and columns were clustered by Ward’s linkage. The predominant blocks of elevated co-clustering are labeled with the control cluster numbers to which the genes that compose the majority of the block belong. As indicated, cluster 6 is dispersed across multiple blocks, primarily the blocks for clusters 3 and 5. (N) Same as (M), except that values are replaced by the proportions in the ΔrosR strain instead of the control strain. Rows and columns ordered as in (M).
Fig 3
Fig 3. Clustered trajectories of differentially expressed transcripts in A549 cells in response to dex.
For each cluster in (A–M), standardized log2 fold change in expression from pre-dex exposure levels is shown for each transcript, and the posterior cluster mean and ±2 standard deviations according to the cluster-specific GP.
Fig 4
Fig 4. Differences in TF binding and histone modification occupancy in A549 cells in control conditions for the four largest DPGP clusters.
(A) Heatmap shows the elastic net logistic regression coefficients for the top twenty predictors (sorted by sum of absolute value across clusters) of cluster membership for the four largest clusters. Predictors were log10 library size-normalized binned counts of ChIP-seq TF binding and histone modification occupancy in control conditions. Distance indicated in row names represents the bin of the predictor (e.g., <1 kb means within 1 kb of the TSS). An additional 23 predictors with smaller but non-zero coefficients are shown in S6 Fig. (B) Kernel density histogram smoothed with a Gaussian kernel and Scott’s bandwidth [63] of the TF binding and histone modification occupancy log10 library size-normalized binned count matrix in control conditions transformed by the first principal component (PC1) for the two largest down-regulated DPGP clusters. (C) Same as (B), but with matrix transformed by PC2 and with the four largest DPGP clusters.
Fig 5
Fig 5. Differences in changes in transcription factor binding in A549 cells in response to glucocorticoid exposure for the four largest DPGP clusters.
(A) Heatmap shows all coefficients (sorted by sum of absolute value across clusters) for predictors with non-zero coefficients as estimated by elastic net logistic regression of cluster membership for the four largest DPGP clusters. Predictors on y-axis represent log fold-change in normalized binned counts of TF binding from ethanol to dex conditions as assayed by ChIP-seq. Distance indicated in row names reflects the bin of the predictor (e.g., 1 kb = within 1 kb of TSS). (B) Boxplots show the logFC in normalized binned counts across clusters and for the group of non-DE transcripts for CREB1, (C) FOXA1, and (D) USF1.

References

    1. Kim SK, Lund J, Kiraly M, Duke K, Jiang M, Stuart JM, et al. A gene expression map for Caenorhabditis elegans. Science. 2001;293(5537): 2087–2092. doi: 10.1126/science.1061603 - DOI - PubMed
    1. Arbeitman MN, Furlong EE, Imam F, Johnson E, Null BH, Baker BS, et al. Gene expression during the life cycle of Drosophila melanogaster. Science. 2002;297(5590): 2270–2275. doi: 10.1126/science.1072152 - DOI - PubMed
    1. Frank CL, Liu F, Wijayatunge R, Song L, Biegler MT, Yang MG, et al. Regulation of chromatin accessibility and Zic binding at enhancers in the developing cerebellum. Nat Neurosci. 2015;18(5):647–656. doi: 10.1038/nn.3995 - DOI - PMC - PubMed
    1. Gasch AP, Spellman PT, Kao CM, Carmel-Harel O, Eisen MB, Storz G, et al. Genomic expression programs in the response of yeast cells to environmental changes. Mol Biol Cell. 2000;11(12): 4241–4257. doi: 10.1091/mbc.11.12.4241 - DOI - PMC - PubMed
    1. Cho RJ, Campbell MJ, Winzeler EA, Steinmetz L, Conway A, Wodicka L, et al. A genome-wide transcriptional analysis of the mitotic cell cycle. Mol Cell. 1998;2(1): 65–73. doi: 10.1016/S1097-2765(00)80114-8 - DOI - PubMed

Publication types

MeSH terms