. 2018 Jan 16;14(1):e1007166.
doi: 10.1371/journal.pgen.1007166. eCollection 2018 Jan.

The impact of ribosomal interference, codon usage, and exit tunnel interactions on translation elongation rate variation

Affiliations

The impact of ribosomal interference, codon usage, and exit tunnel interactions on translation elongation rate variation

Khanh Dao Duc et al. PLoS Genet. .

Erratum in

Abstract

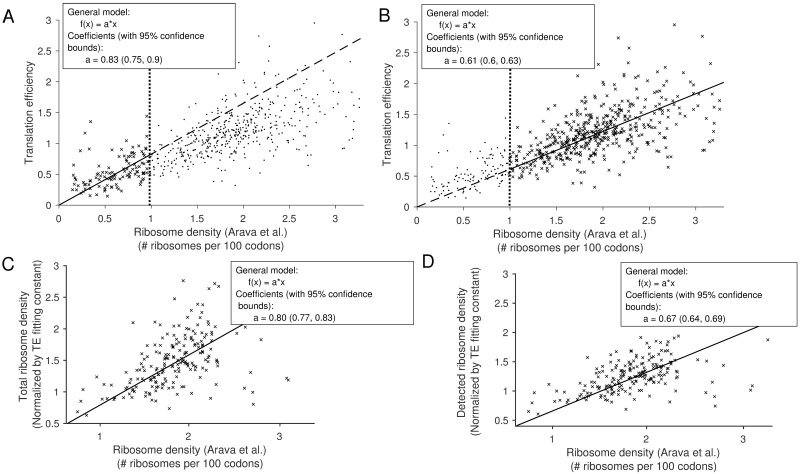
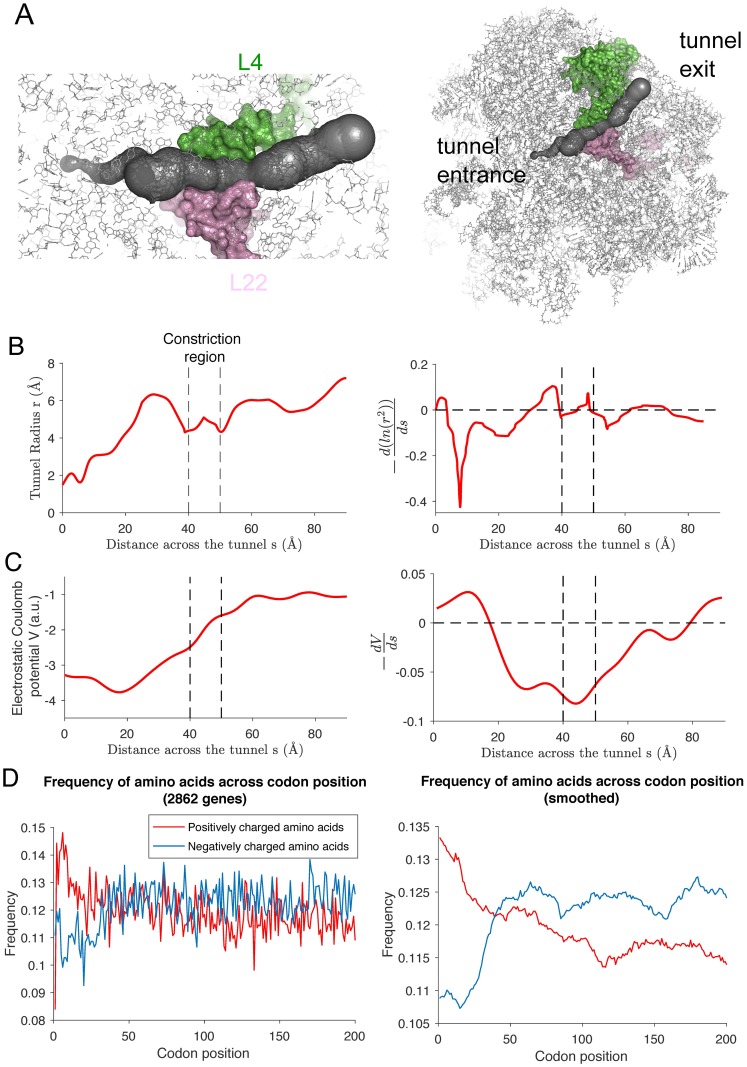
Previous studies have shown that translation elongation is regulated by multiple factors, but the observed heterogeneity remains only partially explained. To dissect quantitatively the different determinants of elongation speed, we use probabilistic modeling to estimate initiation and local elongation rates from ribosome profiling data. This model-based approach allows us to quantify the extent of interference between ribosomes on the same transcript. We show that neither interference nor the distribution of slow codons is sufficient to explain the observed heterogeneity. Instead, we find that electrostatic interactions between the ribosomal exit tunnel and specific parts of the nascent polypeptide govern the elongation rate variation as the polypeptide makes its initial pass through the tunnel. Once the N-terminus has escaped the tunnel, the hydropathy of the nascent polypeptide within the ribosome plays a major role in modulating the speed. We show that our results are consistent with the biophysical properties of the tunnel.


Conflict of interest statement

The authors have declared that no competing interests exist.

Figures

Fig 1
Fig 1. Illustration of translation dynamics and inference from experimental data.
A. A representation of the mathematical model of translation. Initiation corresponds to an event where the A-site of a ribosome enters the second codon position, while elongation corresponds to a movement of the ribosome such that its A-site moves to the next downstream codon. Both events are conditioned on there being no other ribosomes in front obstructing the movement. The ribosome eventually reaches a stop codon and subsequently unbinds from the transcript. In our main simulations, we say that a ribosome is undetected when the distance between the A-sites of consecutive ribosomes is ≤ 12 codons. B. A schematic description of our inference procedure. Given a ribosome profile and a measure of average density (TE), we first approximate the position-specific elongation rates by taking the inverse of the observed footprint number. Then, we use simulation to search over the initiation rate that minimizes the difference between the experimental density and the one obtained from simulation. We then iteratively refine these estimates: We compare the simulation result with the experimental ribosome profile and detect “error-sites” where the absolute density difference is larger than a chosen threshold. If error-sites are found, we start with the one closest to the 5′-end, and jointly optimize the initiation rate and the elongation rates in a neighborhood of this error-site to minimize the error between the simulated and observed profiles. Using these new parameters, we then re-detect possible error-sites located downstream and repeat the procedure (more details in Material and Methods).
Fig 2
Fig 2. Comparison between translation efficiency (TE) and total ribosome density.
All linear fit results are shown in the inset. A. The gene-specific TE for 588 genes from Weinberg et al.’s data [16] (see Materials and Methods) against the corresponding total ribosome density (average number of ribosomes per 100 codons) from Arava et al. [33]. We performed a linear fit of the points for which the corresponding ribosome density was less than 1 ribosome per 100 codons. B. Similar fit as in A in the range of ribosome density larger than 1 ribosome per 100 codons. C. For the genes (195 in total) that belong to both our main dataset and Arava et al.’s, we compared the simulated total densities obtained using our inferred rates, against the ribosome density from Arava et al.D. Simulated detected-ribosome densities for the same 195 genes against the ribosome density from Arava et al. These results suggest that closely-stacked ribosomes comprise a large fraction of undetected ribosomes, and that our method allows us to correct the TE value to get close to the actual total ribosome density.
Fig 3
Fig 3. Analysis and comparison of the inferred rates.
A. (Left) A histogram of inferred initiation rates. (Middle) Comparison between the inferred initiation rates and the inverse of the ORF length of the gene, showing a positive correlation (r = 0.44, p-value < 10−5, computed for unbinned data). (Right) Comparison between the inferred initiation rates and the 5′-cap folding energy computed in Weinberg et al. [16], showing a positive correlation (Pearson’s correlation coefficient r = 0.2646, p-value < 10−5, computed for unbinned data). The interquartile range is indicated by the box, the median by a point inside the box, and upper and lower adjacent values by whiskers. B. Distribution of codon-specific elongation rates. Stop codons are boxed in blue, while the eight low-usage codons reported by Zhang et al. [75] are boxed in red. C. Comparison between the codon-specific mean elongation rates computed from B and (Left) the inverse of the codon mean “ribosome residence time” (RRT) estimated by Gardin et al. [21], and (Right) the tAI value, computed by Tuller et al. [14].
Fig 4
Fig 4. The impact of ribosomal interference on translation dynamics.
A. Analysis of protein production. (Left) A histogram of protein production rates. (Middle) Comparison between the protein production rate and the detected-ribosome density obtained from simulations. In red, we plotted the simulated production rate as a function of ribosome density. The red line corresponds to the production rate when we assume no interference and a constant elongation speed of 5.6 codons/s, which was measured experimentally [7]. (Right) Comparison between the production rate and the total ribosome density density obtained from simulations. B. (Left) Position-specific elongation rates averaged over all transcript sequences, aligned with respect to the start codon. Plotted are the inferred unobstructed rate (in red) and the observed rate (in blue). The bottom plot shows the difference between the two curves. (Right) Similar plots as the ones on the left, when the transcript sequences are aligned with respect to the stop codon position.
Fig 5
Fig 5. Heterogeneity of codon distributions and elongation speed along the transcript.
A. Codon frequency metagene analysis. We grouped the codons (except stop codons) into five groups according to their mean elongation rates (MER) and plotted their frequency of appearance at each position in the set of genes we considered. The first group contained 4 codons with MER between 4 and 6 codons/s; the second group 13 codons with MER between 6 and 8; the third group 13 codons with MER between 8 and 10; the fourth group 16 codons with MER between 10 and 12; and the fifth group 15 codons with MER > 12. B. Smoothed mean elongation speed along the ORF for each codon type (stop codons are excluded). At each position i, we computed an average of codon-specific MER between positions i − 20 and i + 20. In black, we plot an average of the 61 curves.
Fig 6
Fig 6. Linear model fits of the mean deviation of elongation rates for the data from Weinberg et al. [16].
The dependent variable is the mean deviation of elongation rates from codon-type-specific average elongation rates. Green lines correspond to the estimates from ribosome profiling data, while red dots correspond to our model fits based on a small (1 or 3) number of features. A. A fit for codon positions [6 : 44] obtained using three features: the mean PARS score in the window [9 : 19] downstream of the A-site, the mean number of negatively charged nascent amino acid residues in the window [6 : 14] upstream of the A-site, and the mean number of positively charged residues in the window [1 : 11] upstream of the A-site. The first two features had negative regression coefficients, while the last one had a positive regression coefficient. The coefficient of determination R2 was 0.91 for this fit. B. A fit (R2 = 0.84) for the region [45 : 300] obtained using only a single feature: the mean hydropathy of the nascent peptide segment in the window [1 : 42] upstream of the A-site.
Fig 7
Fig 7. Biophysical properties of the ribosome exit tunnel.
A. The figure on the left illustrates the exit tunnel (in black) and ribosomal proteins L4 (in pink) and L22 (in green) surrounding the constriction region. We extracted the tunnel geometry from the cryo-EM structure of the ribosome large subunit [39] illustrated on the right (side view, see also S16 Fig). B. (Left) The variation of the tunnel radius r along the tunnel. (Right) The negative gradient of ln(r2) (smoothed over a 10 Å window). Note a region of large negative “entropic” potential [73] in the upper region of the exit tunnel. C. (Left) The variation of the electrostatic Coulomb potential induced by ribosomal RNA and proteins within a radius of 20 Å from the center of the tunnel. (Right) The negative gradient of the potential (smoothed over a 10 Å window), notably showing a region of positive electric field (pointing towards the exit) in the region 0 ∼ 18 Å. D. (Left) Position-specific average frequencies of positively (red) and negatively (blue) charged amino acids averaged over all genes of length ≥ 200 codons. (Right) The frequency curves smoothed by averaging over a 10-codon window. Compared to other parts of the transcript, the frequency of positive (negative) amino acids is significantly higher (lower) in the first ∼25 codons.

References

    1. Ingolia NT, Ghaemmaghami S, Newman JR, Weissman JS. Genome-wide analysis in vivo of translation with nucleotide resolution using ribosome profiling. Science. 2009;324(5924):218–223. doi: 10.1126/science.1168978 - DOI - PMC - PubMed
    1. Ingolia NT, Brar GA, Rouskin S, McGeachy AM, Weissman JS. The ribosome profiling strategy for monitoring translation in vivo by deep sequencing of ribosome-protected mRNA fragments. Nature Protocols. 2012;7(8):1534–1550. doi: 10.1038/nprot.2012.086 - DOI - PMC - PubMed
    1. Ingolia NT, Brar GA, Rouskin S, McGeachy AM, Weissman JS. Genome-Wide Annotation and Quantitation of Translation by Ribosome Profiling Current Protocols in Molecular Biology. 2013; Chapter 4: Unit 4.18. - PMC - PubMed
    1. Ingolia NT. Ribosome profiling: new views of translation, from single codons to genome scale. Nature Reviews Genetics. 2014;15(3):205–213. doi: 10.1038/nrg3645 - DOI - PubMed
    1. Vogel C, Marcotte EM. Insights into the regulation of protein abundance from proteomic and transcriptomic analyses. Nature Reviews Genetics. 2012;13(4):227–232. doi: 10.1038/nrg3185 - DOI - PMC - PubMed

Publication types