. 2018 Jan 16;13(1):e0191141.
doi: 10.1371/journal.pone.0191141. eCollection 2018.

Distribution of cone density, spacing and arrangement in adult healthy retinas with adaptive optics flood illumination

Affiliations

Distribution of cone density, spacing and arrangement in adult healthy retinas with adaptive optics flood illumination

Richard Legras et al. PLoS One. .

Abstract

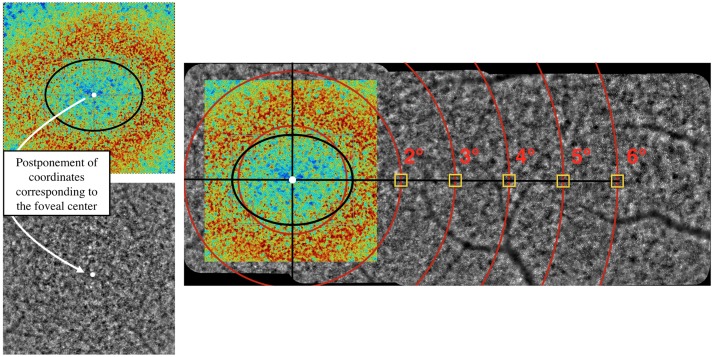
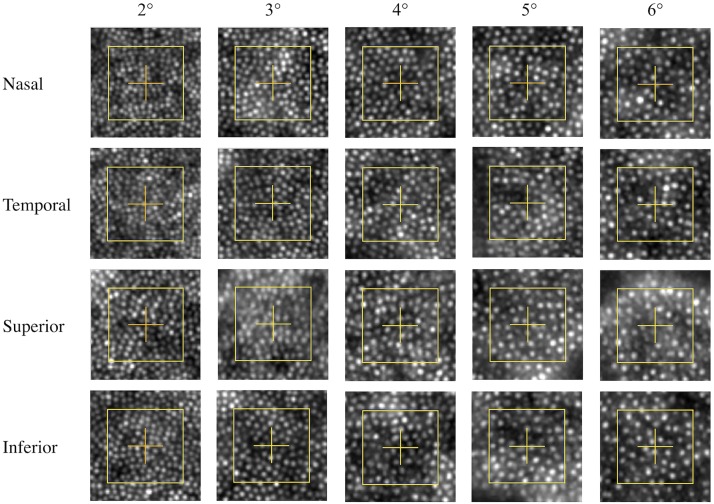
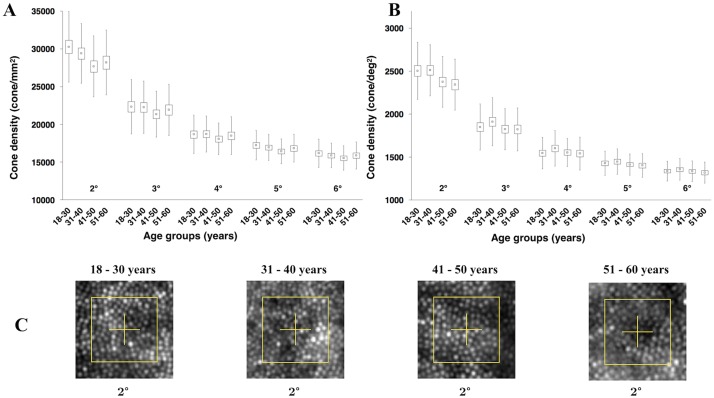
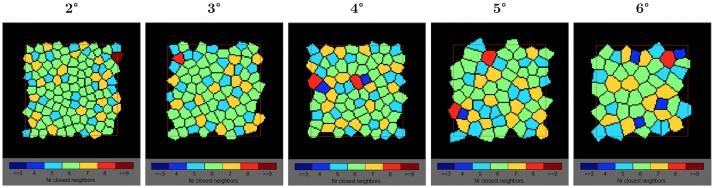
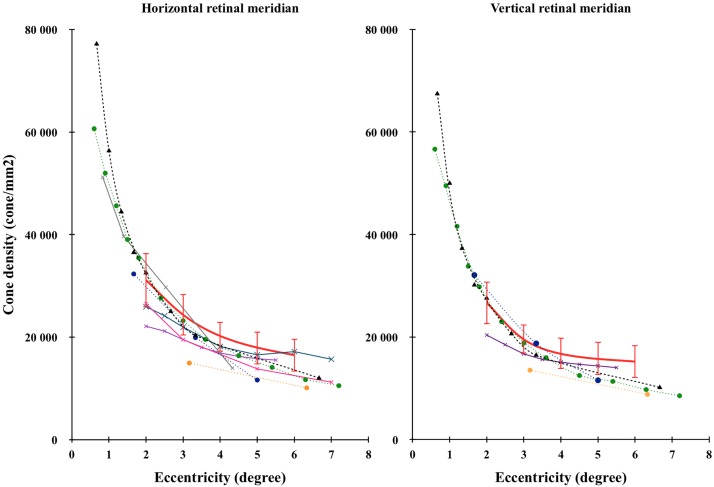
The aim of this article is to analyse cone density, spacing and arrangement using an adaptive optics flood illumination retina camera (rtx1™) on a healthy population. Cone density, cone spacing and packing arrangements were measured on the right retinas of 109 subjects at 2°, 3°, 4°, 5° and 6° of eccentricity along 4 meridians. The effects of eccentricity, meridian, axial length, spherical equivalent, gender and age were evaluated. Cone density decreased on average from 28 884 ± 3 692 cones/mm2, at 2° of eccentricity, to 15 843 ± 1 598 cones/mm2 at 6°. A strong inter-individual variation, especially at 2°, was observed. No important difference of cone density was observed between the nasal and temporal meridians or between the superior and inferior meridians. However, the horizontal and vertical meridians differed by around 14% (T-test, p<0.0001). Cone density, expressed in units of area, decreased as a function of axial length (r2 = 0.60), but remained constant (r2 = 0.05) when cone density is expressed in terms of visual angle supporting the hypothesis that the retina is stretched during the elongation of the eyeball. Gender did not modify the cone distribution. Cone density was slightly modified by age but only at 2°. The older group showed a smaller density (7%). Cone spacing increased from 6,49 ± 0,42 μm to 8,72 ± 0,45 μm respectively between 2° and 6° of eccentricity. The mosaic of the retina is mainly triangularly arranged (i.e. cells with 5 to 7 neighbors) from 2° to 6°. Around half of the cells had 6 neighbors.


Conflict of interest statement

Competing Interests: We received funds from Imagine Eyes (Orsay, France) to conduct the experiment described in this manuscript. The funds permitted to partially acquire the rtx1 device manufactured by Imagine Eyes. Imagine Eyes had no other role. They did not participate to the study design; collection, analysis, and interpretation of data; writing of the paper; and/or decision to submit for publication. We claim that this does not alter our adherence to PLOS ONE policies on sharing data and materials.

Figures

Fig 1
Fig 1. Illustration of the method used to determine the foveal center.
The montage allows to accurately determine the eccentricities. The Region Of Interest (ROI) of 80 x 80 pixels is represented by a yellow square.
Fig 2
Fig 2. Images of ROI (yellow square) analysed at 2°, 3°, 4°, 5° and 6° (columns) along the nasal, temporal, superior and inferior meridians of one typical subject.
We can observed a decrease of cone density with eccentricity as well as a difference of cone density between the horizontal and vertical meridians.
Fig 3
Fig 3. Cone density as a function of age and eccentricity.
(A) Results expressed in metric units and (B) in visual units. (C) Images of ROI (yellow square) analysed at 2° of eccentricity for one subject representative of each age group. Yellow squares represent area of the retina when expressed in visual unit (i.e., 80 pixels or around 13 minutes of arc). We can observe a difference of cone density between the two first groups (i.e., between 18 and 40 years old) and the two last groups (i.e., between 41 and 60 years old).
Fig 4
Fig 4. Voronoï analysis with the representation of the spatial distribution of cones.
We can observe a small decrease of the proportion of cones with exactly 6 neighbors as a function of eccentricity. In green, cells with 6 neighbors. In orange, cells with 7 neighbors and in light blue, cells with 5 neighbors.
Fig 5
Fig 5. Comparison of cone density as a function of eccentricity with the literature.
Horizontal (left) and vertical (right) retinal meridians were compared with the literature. Error bars represent the interval of confidence (± 2SD). The red curve represents our data (rtx1, 109 retinas), the black dashed curve with triangles represents Curcio’s data (histology, 8 retinas) [2], the orange dashed curve with circles represents Chui’s data (AOSLO, 11 retinas) [5], the green dashed curve with circles represents Song’s data (AOSLO, 20 retinas) [7], the blue dashed curve with circles represents Park’s data (AOSLO, 192 retinas) [8], the grey curve with crosses represents Lombardo’s data (rtx1, 20 retinas) [13], the pink curve with crosses represents Muthiah’s data (rtx1, 3 retinas) [17], the purple curve with crosses represents Feng’s data (rtx1, 35 retinas) [20] and the blue curve with crosses represents Jacob’s data (rtx1, 28 retinas) [22].

References

    1. Osterberg G. Topography of the layer of rods and cones in the human retina. Acta ophthal Suppl. 1935;6:11–97.
    1. Curcio CA, Sloan KR, Kalina RE, Hendrickson AE. Human photoreceptor topography. J Comp Neurol. 1990;292(4):497–523. doi: 10.1002/cne.902920402 . - DOI - PubMed
    1. Li KY, Roorda A. Automated identification of cone photoreceptors in adaptive optics retinal images. J Opt Soc Am A Opt Image Sci Vis. 2007;24(5):1358–63. . - PubMed
    1. Chui TY, Song H, Burns SA. Adaptive-optics imaging of human cone photoreceptor distribution. J Opt Soc Am A Opt Image Sci Vis. 2008;25(12):3021–9. . - PMC - PubMed
    1. Chui TY, Song H, Burns SA. Individual variations in human cone photoreceptor packing density: variations with refractive error. Invest Ophthalmol Vis Sci. 2008;49(10):4679–87. doi: 10.1167/iovs.08-2135 . - DOI - PMC - PubMed

Publication types

LinkOut - more resources